Jump to content

FTSE 100 Price Outlook: Global Stock Market Rally May be Short-Lived


MongiIG

2,205 views

FTSE 100 PRICE, NEWS AND ANALYSIS:

  • Several factors are lifting stock markets near term, including hopes that an agreement on the US debt ceiling is close, Putin’s offer to stabilize the world energy markets and a potential meeting of Xi and Biden.
  • However, worries about China persist, and this rally may just reflect some short-covering and dip-buying before stock markets head lower again.

Stock market drops 8% - bigger than 9/11 - over oil price war and  coronavirus fears - Mirror Online


FTSE 100 RALLY MAY NOT LAST LONG

World stock markets, including London’s, are benefiting from a more helpful news flow. First up, US Democrats have signaled that they will take up Senate Republican leader Mitch McConnell’s offer to raise the US debt ceiling, reducing the admittedly highly unlikely risk of a US default on its debts.

Second, Russian President Vladimir Putin has offered to stabilize global energy markets, hinting that the State-backed Gazprom could increase supplies to help Europe. Third, US President Joe Biden and Chinese President Xi Jinping have reportedly agreed to hold a virtual summit that could reduce the tensions between the two countries. And fourth, the European Central Bank is reported to be considering a new bond-buying program to stabilize markets after its pandemic emergency purchase program (PEPP) ends in March.

That has all combined to weaken the oil and natural gas markets but strengthened global stock market indexes, including London’s FTSE 100.

FTSE 100 PRICE CHART, ONE-HOUR TIMEFRAME (SEPTEMBER 30 – OCTOBER 7, 2021)

Latest FTSE 100 price chart.

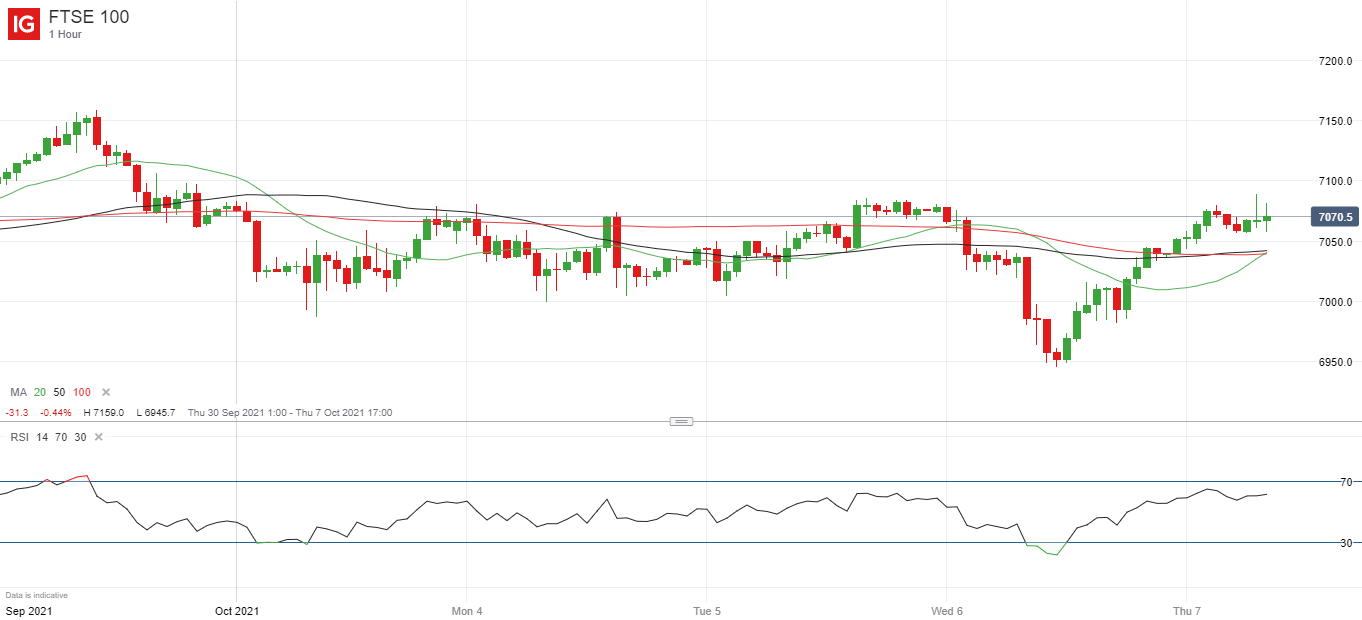
Source: IG (You can click on it for a larger image)

MARKET WORRIES PERSIST

Note, though, that the small advance that began mid-Wednesday could easily reverse. China’s troubled power and property sectors remain a background concern, and the latest rally may just represent some dip-buying and short-covering that will soon be over.

Friday’s US labor-market report is another potential hurdle. Economists polled by the news agencies expect non-farm payrolls to have risen by a hefty 500,000 in September, up from 235,000, and a good figure could prompt the Federal Reserve to taper monetary stimulus as early as next month… a move that would likely damage market confidence.

BEARISH FTSE SIGNAL FROM SENTIMENT DATA

As for retail trader positioning, IG client sentiment data show 69.10% of traders are net-long the FTSE 100, with the ratio of traders long to short at 2.24 to 1. The number of traders net-long is 12.58% higher than yesterday and 13.64% higher than last week, while the number of traders net-short is 14.30% lower than yesterday and 27.11% lower than last week.

Here at DailyFX, we typically take a contrarian view to crowd sentiment, and the fact traders are net-long suggests FTSE 100 prices may weaken. Traders are further net-long than yesterday and last week, and the combination of current sentiment and recent changes gives us a stronger FTSE 100-bearish contrarian trading bias.

Written by Martin Essex, Analyst, 7th October 2021. DailyFX

1 Comment


Recommended Comments

I was considering going in but there were too many non confirmations in my signals for me. It seems the rally was driven by the usual suspects - that narrow handful of mega cap stocks that responded to the lower gas price, lower inflation, lower interest rates meme. But with disrupted supply where it is and the under investment in oil the last few years, I don't think that particular story is over just yet for this cycle. 

And as stated in the article, the bounce had that feeling of sharp short covering on hopeful news flow that was characteristic of the Great Financial Crisis.

My main worry is the valuation of tech and the effect a small tightening in monetary policy may have on the entire edifice.

  • Like 1
Link to comment

Create an account or sign in to comment

You need to be a member in order to leave a comment

Create an account

Sign up for a new account in our community. It's easy!

Register a new account

Sign in

Already have an account? Sign in here.

Sign In Now
  • Blog Statistics

    • Total Blogs
      3
    • Total Entries
      2,821
  • Latest Forum Topics

  • Our picks

    • Are these the best AI stocks to watch in May 2024?
      Microsoft, Apple, Nvidia, Amazon and Meta could be the best AI stocks to watch next month. These stocks are the largest AI stocks in the US based on market capitalisation.
    • Natural Gas Commodity Elliottwave Technical Analysis
      Natural Gas


      Mode - Impulsive 


      Structure - Impulse Wave 


      Position - Wave (iii) of 5


      Direction - Wave (iii) of 5 still in play


      Details:  Price now in wave iii as it attempts to breach 1.65 wave i low. Wave (iii) is still expected to extend lower in an impulse.


      Natural Gas is currently breaching the previous April low, marking a decisive move as the impulse initiated on 5th March continues its downward trajectory, further extending the overarching impulse wave sequence that commenced back in August 2022. This decline is anticipated to persist as long as the price remains below the critical resistance level of 2.012.


      Zooming in on the daily chart, we observe the medium-term impulse wave originating from August 2022, which is persisting in its downward trend after completing its 4th wave - delineated as primary wave 4 in blue (circled) - at 3.666 in October 2023. Presently, the 5th wave, identified as primary blue wave 5, is underway, manifesting as an impulse at the intermediate degree in red. It is envisaged that the price will breach the February 2024 low of 1.533 as wave 5 of (3) seeks culmination before an anticipated rebound in wave (4). This confluence of price movements underscores the bearish sentiment prevailing over Natural Gas in the medium term.


      Analyzing the H4 chart, we initiated the impulse wave count for wave (3) from the level of 2.012, which marks the termination point of wave 4. Notably, price action formed a 1-2-1-2 structure, with confirmation established at 1.65 and invalidation set at 2.012. The confirmation of our anticipated direction materialized as price breached the 1.65 mark, signifying a resumption of bearish momentum. Presently, there appears to be minimal resistance hindering the bears, thereby reinstating their dominance in the market. It is projected that wave iii of (iii) of 5 will manifest around 1.43, indicative of the potential for the wave 5 low to extend to 1.3 or even lower. This comprehensive analysis underscores the prevailing bearish outlook for Natural Gas in the immediate future.


      Technical Analyst : Sanmi Adeagbo
       
        • Like
    • Meta Platforms’ earnings round-up: Share price plunged despite 1Q beat
      Meta’s share price plunged as much as 16% in post-market trading, following the release of its 1Q 2024 results.
×
×
  • Create New...
us