Jump to content

Canadian Dollar Forecast: USD/CAD Sell-Off Continues, Retail Traders Increase Short Bets


MongiIG

1,283 views

USD/CAD slides lower on US dollar weakness, while retail traders increase their USD/CAD short bets

Canadian Dollar Price, Chart, and Analysis

  • Brent crude oil eyes a new three-year high.
  • USD/CAD traders increase short bets.

Canadian Dollar Futures | CAD Futures Prices & Contracts | RJO Futures

The US dollar continues to lose ground against its Canadian counterpart with the pair touching a new three-month low earlier in the session.The recent trend lower is dominated by red candles, producing lower highs and lower lows, as the pair continues to move towards a multi-year low around the 1.2000 level.

One of the drivers of the recent move, the price of oil, continues to direct the pair with Brent crude starting to consolidate Monday’s sell-off. The move higher from the late-August low around $65/bbl. has been relentless and it looks likely that oil higher prices will be seen in the coming weeks, especially with the winter season approaching. Analysts expect the oil supply/demand to continue as economies across the globe continue to reopen, while OPEC+ keeps supply limited going into the end of the year.

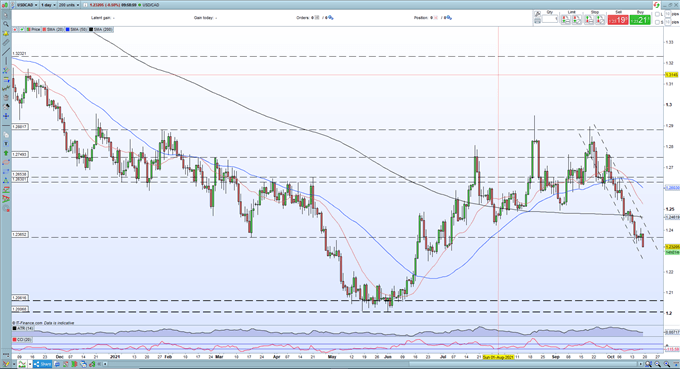
The daily USD/CAD chart shows a clear downtrend started off the September 20 high with any pull-backs sold into it. Various levels of support have been broken with ease, while the simple moving averages are also throwing out negative signals. The 20-dsma has dropped through the 50-dsma and is close to breaking the 200-dsma, while USD/CAD is now back below the longer-dated simple moving average, adding to negative sentiment. The next levels of support are around 1.2300 and 1.2250.

Canadian Dollar (USD/CAD) Daily Price Chart October 19, 2021

Canadian Dollar Forecast: USD/CAD Sell-Off Continues, Retail Traders Increase Short Bets

Retail trader data show 73.21% of traders are net-long with the ratio of traders long to short at 2.73 to 1. The number of traders net-long is 0.60% lower than yesterday and 7.22% lower from last week, while the number of traders net-short is 26.57% higher than yesterday and 14.20% higher from last week.

We typically take a contrarian view to crowd sentiment, and the fact traders are net-long suggests USD/CAD prices may continue to fall.Yet traders are less net-long than yesterday and compared with last week. Recent changes in sentiment warn that the current USD/CAD price trend may soon reverse higher despite the fact traders remain net-long.

image.png

What is your view on the USD/CAD – bullish or bearish?


By Nick Cawley, Strategist, 19th October 2021. DailyFX

0 Comments


Recommended Comments

There are no comments to display.

Create an account or sign in to comment

You need to be a member in order to leave a comment

Create an account

Sign up for a new account in our community. It's easy!

Register a new account

Sign in

Already have an account? Sign in here.

Sign In Now
  • Blog Statistics

    • Total Blogs
      3
    • Total Entries
      2,821
  • Latest Forum Topics

  • Our picks

    • Are these the best AI stocks to watch in May 2024?
      Microsoft, Apple, Nvidia, Amazon and Meta could be the best AI stocks to watch next month. These stocks are the largest AI stocks in the US based on market capitalisation.
    • Natural Gas Commodity Elliottwave Technical Analysis
      Natural Gas


      Mode - Impulsive 


      Structure - Impulse Wave 


      Position - Wave (iii) of 5


      Direction - Wave (iii) of 5 still in play


      Details:  Price now in wave iii as it attempts to breach 1.65 wave i low. Wave (iii) is still expected to extend lower in an impulse.


      Natural Gas is currently breaching the previous April low, marking a decisive move as the impulse initiated on 5th March continues its downward trajectory, further extending the overarching impulse wave sequence that commenced back in August 2022. This decline is anticipated to persist as long as the price remains below the critical resistance level of 2.012.


      Zooming in on the daily chart, we observe the medium-term impulse wave originating from August 2022, which is persisting in its downward trend after completing its 4th wave - delineated as primary wave 4 in blue (circled) - at 3.666 in October 2023. Presently, the 5th wave, identified as primary blue wave 5, is underway, manifesting as an impulse at the intermediate degree in red. It is envisaged that the price will breach the February 2024 low of 1.533 as wave 5 of (3) seeks culmination before an anticipated rebound in wave (4). This confluence of price movements underscores the bearish sentiment prevailing over Natural Gas in the medium term.


      Analyzing the H4 chart, we initiated the impulse wave count for wave (3) from the level of 2.012, which marks the termination point of wave 4. Notably, price action formed a 1-2-1-2 structure, with confirmation established at 1.65 and invalidation set at 2.012. The confirmation of our anticipated direction materialized as price breached the 1.65 mark, signifying a resumption of bearish momentum. Presently, there appears to be minimal resistance hindering the bears, thereby reinstating their dominance in the market. It is projected that wave iii of (iii) of 5 will manifest around 1.43, indicative of the potential for the wave 5 low to extend to 1.3 or even lower. This comprehensive analysis underscores the prevailing bearish outlook for Natural Gas in the immediate future.


      Technical Analyst : Sanmi Adeagbo
       
        • Like
    • Meta Platforms’ earnings round-up: Share price plunged despite 1Q beat
      Meta’s share price plunged as much as 16% in post-market trading, following the release of its 1Q 2024 results.
×
×
  • Create New...
us