Jump to content

Crude Oil Price Forecast: Extended with Levels to Watch


MongiIG

1,383 views

CRUDE OIL TECHNICAL HIGHLIGHTS:

  • Trading well above major long-term resistance.
  • Watching levels that lie just ahead from years prior.
  • Outlook remains generally bullish until proven otherwise.

Crude Oil Forecast: Bears Take Control on Inventory Build, Potential SPR  Release

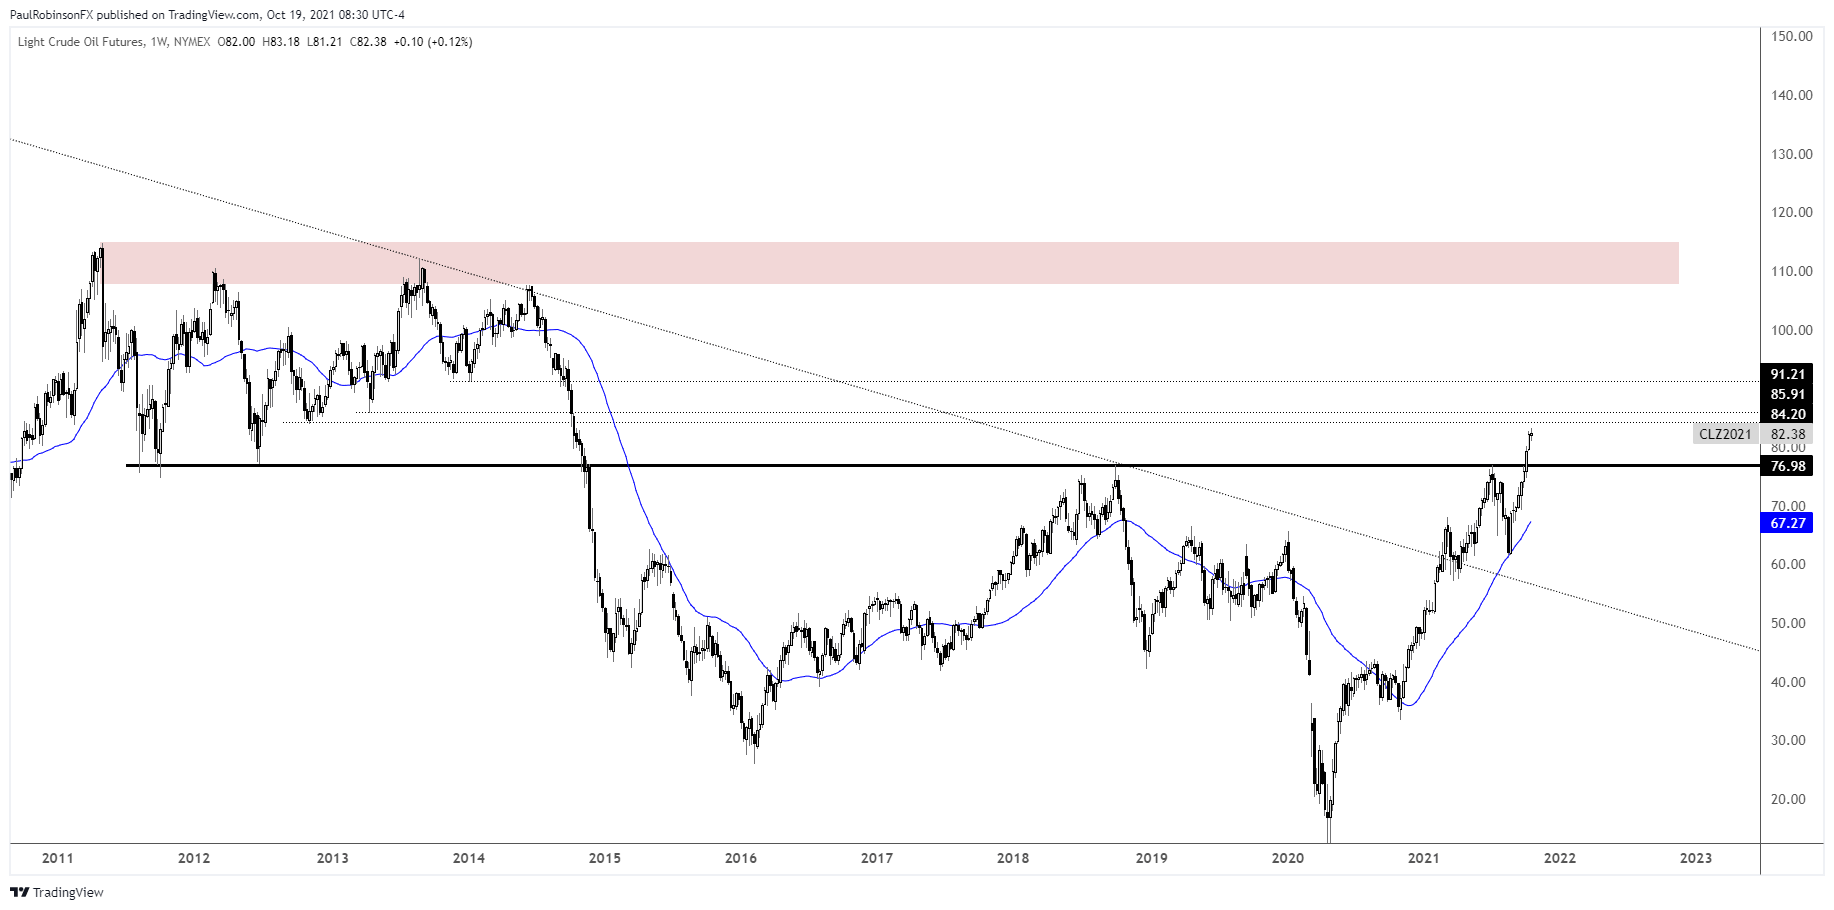
Energy has been on a tear, with crude oil having recently broke above a major long-term threshold. Right around 77 was big resistance from a decade ago, a level we discussed as being pivotal for the broader outlook on oil.

Now that it is well above that level we need to turn our attention to resistance levels that lie ahead. The levels in question aren’t the most significant types of levels, but nevertheless should be respected. This is where watching price action as levels get tested becomes so important.

If momentum doesn’t slow then it indicates that the level isn’t important, but if volatility (i.e. reversal candles) occurs then we will want to heeds its warnings.

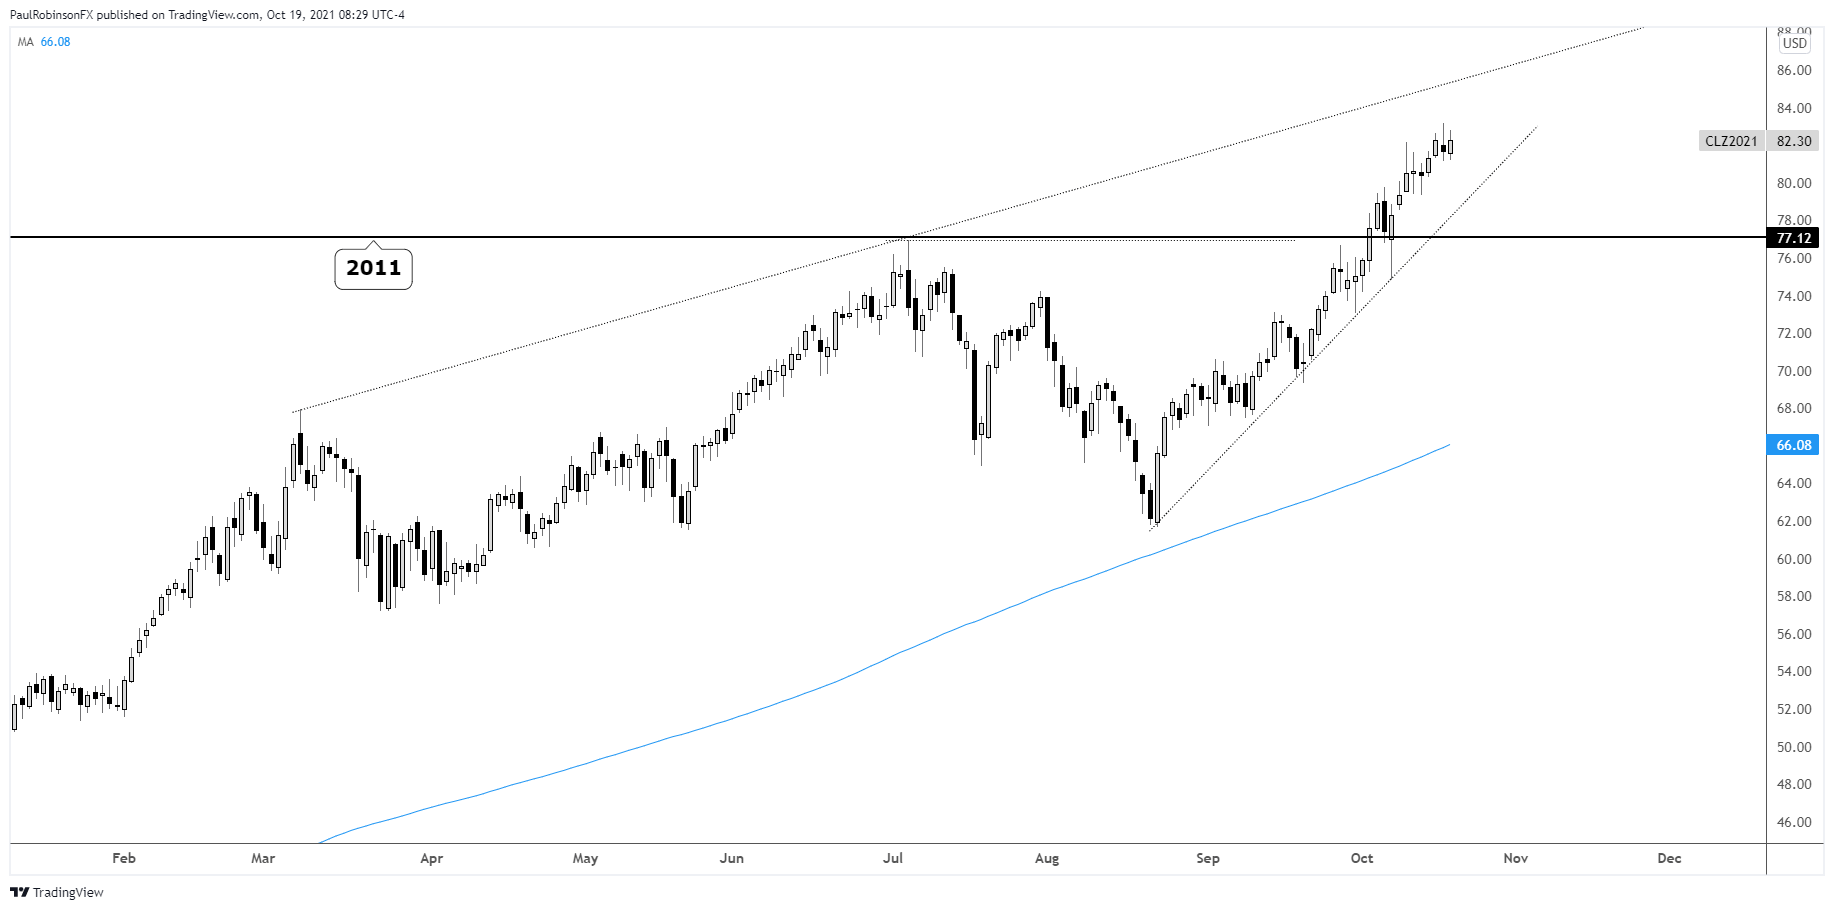
From 2012 to 2014 there are lows at 84, 85.90, and 91.24 to watch. Around the 85 also lies a top-side trend-line running over from March. With the price of oil extended we may see a bit of a reaction at one of these upcoming levels even if it is only a minor one that is erased with even higher levels.

Generally the outlook remains bullish, but appears risky for new longs to chase here. For existing longs, implementing some type of trailing stop strategy may be a prudent move. To flip the script from bullish to bearish there is some work to be done. On a retracement the first threshold to watch is the trend-line rising up from August, and then after that the big long-term level at 77.


CRUDE OIL (CL1!) WEEKLY CHART

crude oil weekly chart

CRUDE OIL (CL1!) DAILY CHART

crude oil daily chart

WTI Crude Oil Chart by TradingView

Resources for Forex Traders

Whether you are a new or experienced trader, we have several resources available to help you; indicator for tracking trader sentiment, quarterly trading forecasts, analytical and educational webinars held daily, trading guides to help you improve trading performance, and one specifically for those who are new to forex.

Written by Paul Robinson, Market Analyst, 19th October 2021. DailyFX

0 Comments


Recommended Comments

There are no comments to display.

Create an account or sign in to comment

You need to be a member in order to leave a comment

Create an account

Sign up for a new account in our community. It's easy!

Register a new account

Sign in

Already have an account? Sign in here.

Sign In Now
  • Blog Statistics

    • Total Blogs
      3
    • Total Entries
      2,821
  • Latest Forum Topics

  • Our picks

    • Are these the best AI stocks to watch in May 2024?
      Microsoft, Apple, Nvidia, Amazon and Meta could be the best AI stocks to watch next month. These stocks are the largest AI stocks in the US based on market capitalisation.
    • Are these the best AI stocks to watch in May 2024?
      Microsoft, Apple, Nvidia, Amazon and Meta could be the best AI stocks to watch next month. These stocks are the largest AI stocks in the US based on market capitalisation.
    • Natural Gas Commodity Elliottwave Technical Analysis
      Natural Gas


      Mode - Impulsive 


      Structure - Impulse Wave 


      Position - Wave (iii) of 5


      Direction - Wave (iii) of 5 still in play


      Details:  Price now in wave iii as it attempts to breach 1.65 wave i low. Wave (iii) is still expected to extend lower in an impulse.


      Natural Gas is currently breaching the previous April low, marking a decisive move as the impulse initiated on 5th March continues its downward trajectory, further extending the overarching impulse wave sequence that commenced back in August 2022. This decline is anticipated to persist as long as the price remains below the critical resistance level of 2.012.


      Zooming in on the daily chart, we observe the medium-term impulse wave originating from August 2022, which is persisting in its downward trend after completing its 4th wave - delineated as primary wave 4 in blue (circled) - at 3.666 in October 2023. Presently, the 5th wave, identified as primary blue wave 5, is underway, manifesting as an impulse at the intermediate degree in red. It is envisaged that the price will breach the February 2024 low of 1.533 as wave 5 of (3) seeks culmination before an anticipated rebound in wave (4). This confluence of price movements underscores the bearish sentiment prevailing over Natural Gas in the medium term.


      Analyzing the H4 chart, we initiated the impulse wave count for wave (3) from the level of 2.012, which marks the termination point of wave 4. Notably, price action formed a 1-2-1-2 structure, with confirmation established at 1.65 and invalidation set at 2.012. The confirmation of our anticipated direction materialized as price breached the 1.65 mark, signifying a resumption of bearish momentum. Presently, there appears to be minimal resistance hindering the bears, thereby reinstating their dominance in the market. It is projected that wave iii of (iii) of 5 will manifest around 1.43, indicative of the potential for the wave 5 low to extend to 1.3 or even lower. This comprehensive analysis underscores the prevailing bearish outlook for Natural Gas in the immediate future.


      Technical Analyst : Sanmi Adeagbo
       
        • Like
×
×
  • Create New...
us