US jobs report preview: ADP and ISM surveys signal potential improvement for US NFP figure

Entry posted by MongiIG in Market News
1,431 views
Friday’s upcoming US jobs report looks to bring a rebound in payrolls, with ADP and ISM surveys signalling a potential improvement after two months of weak NFP’s.
 Source: Bloomberg
The October US jobs report is due to be released at 1.30pm, on Friday 5 November (UK time). Fresh off the back of the November Federal Open Market Committee (FOMC) meeting, investors look set to shift their focus towards the question of whether the US jobs market is healthy enough to begin hiking rates next year.
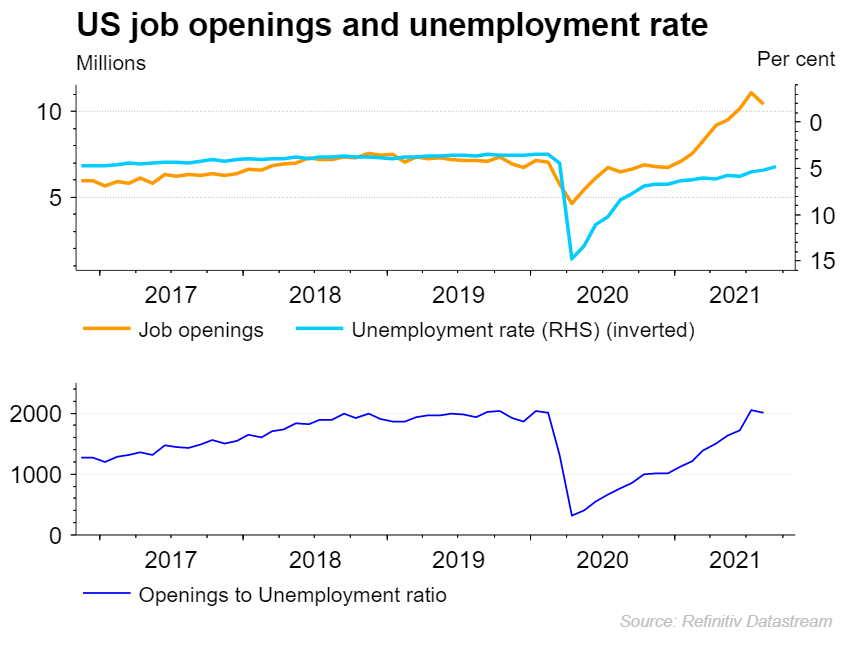
Recent weakness in the US payrolls number could be perceived as a potential reason for caution at the Federal Reserve (Fed). However, with many businesses referring to the staff shortages, there is a feeling that weakness in the payrolls figure could simply be a case of businesses struggling to find candidates rather than being unwilling to hire. The chart below highlights how US vacancies recently reached a record high, with the ratio between openings and unemployment back to pre-pandemic levels.
 Source: Refinitiv Datasream
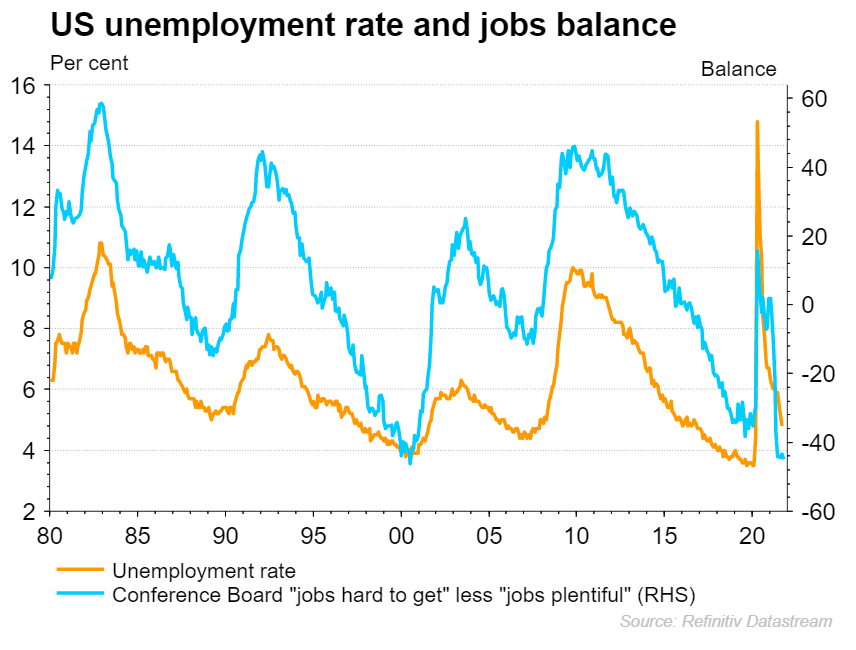
Another way of looking at the jobs market is through the notable 'Conference board' survey, with the ratio of those finding jobs 'hard to find' vs 'plentiful' back down to 11-year lows.
 Source: Refinitiv Datasream
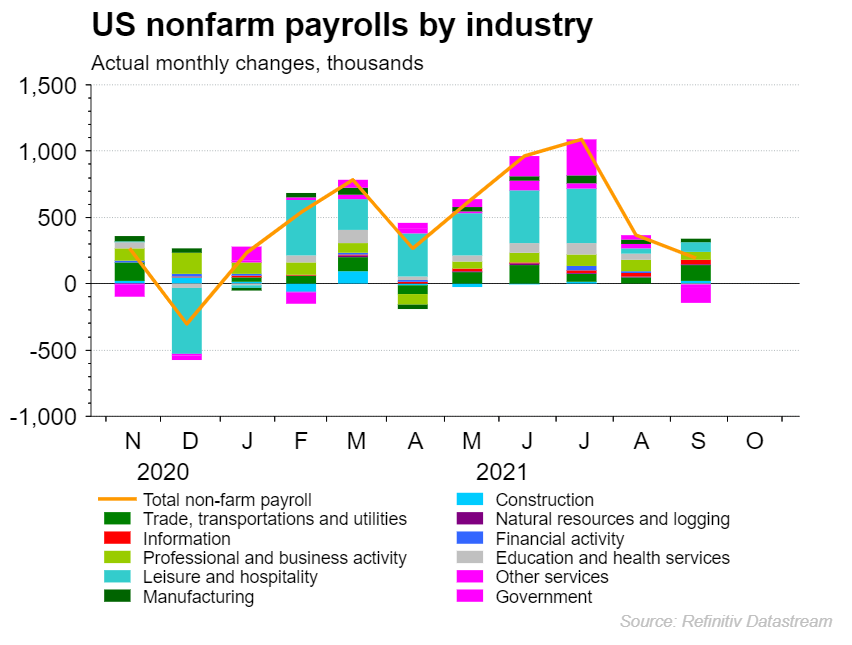
With the past two payrolls figures coming in well below market estimates, this week will provide an update on whether businesses are finally managing to fill positions. Looking at the breakdown of the latest payrolls figure, we can see that the September non-farms payroll (NFP) number felt a significant from falling government hiring.
 Source: Refinitiv Datasream
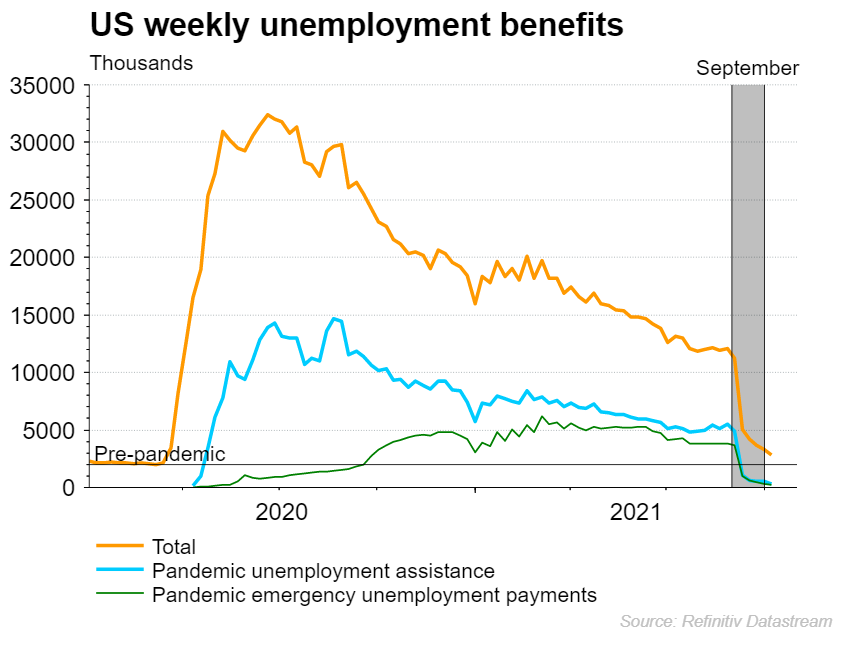
The sharp reduction in government benefits over the course of September does account for one shock to the system that could account for the weakness seen last month. However, the fact that we are seeing government programmes draw to an end does highlight the growing incentive for many to find employment in what is a very buoyant jobs market.
 Source: Refinitiv Datasream
Non-farm Payrolls
Last month surprised many, with the expected rebound failing to materialise to bring a 194k figure that was even lower than the August reading of 235k. While many will see those two figures as a sign of weakness, we have seen previously that this is significantly impacted by a lack of labour availability more than businesses being unwilling to hire.
Nonetheless, markets will want to see that trend change, as those falling off government benefits opt to move into employment. This time around we are looking for a figure closer to the 455k mark, but whether we see that come to fruition remains to be seen given recent disappointment.
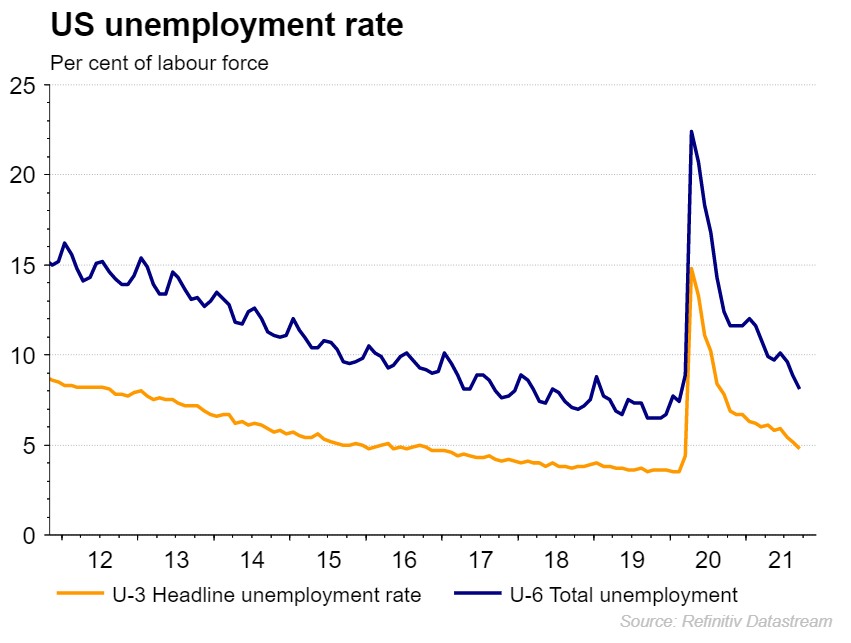
Unemployment
On the unemployment front, we have seen things move in the right direction despite payrolls volatility. So much so that unemployment has dropped from 7.9% to 4.8% over the past year. Markets expect to see that trend continue, with a reading of 4.7% predicted on Friday.
It is also worth noting that while unemployment has been declining, we also have the potential for a rise in the participation rate which can hold back any improvements in the unemployment rate. With that in mind, also watch out for the U-6 measure of unemployment which provides a wider reading to account for many that would have dropped out of the headline reading.
 Source: Refinitiv Datasream
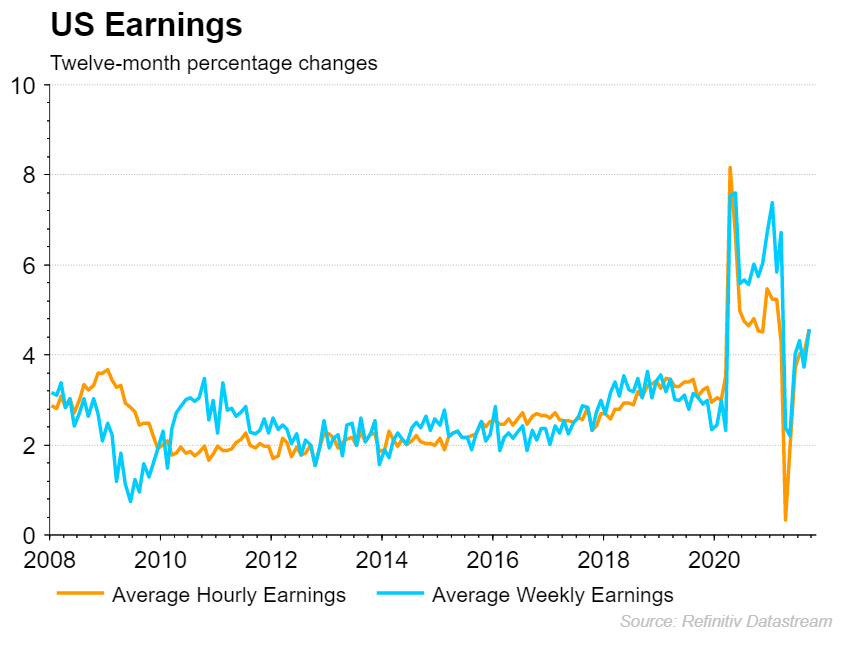
Wages
Wage growth has been strong over the course of the past year, with the 4.6% rise in average hourly earnings providing yet another concern for the Fed given the impact on business costs and thus inflation. That trend shows little sign of letting up, with markets looking for a figure between 4.7% and 4.9%.
 Source: Refinitiv Datasream
What do other employment surveys tell us?
One way to predict where Friday’s jobs report may move is to look at some of the alternate employment readings for gauge on the state of play.
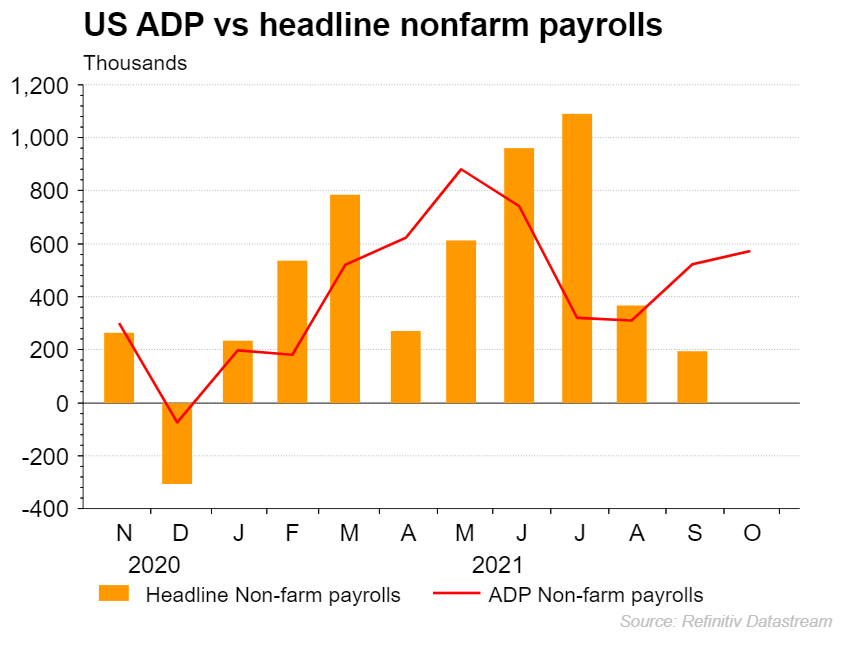
Automatic data processing (ADP) payrolls – The latest October ADP payrolls figure a welcome bounce, with a reading of 571k pointing towards a potential recovery for the headline figure. While the correlation between the ADP and headline NFP payrolls figures may not be perfect, it does often help highlight the direction of travel ahead of time. Last time around we saw a sharp decline in government hiring to drag down the headline figure. It seems unlikely that will happen again, signalling a potential rebound on Friday.
 Source: Refinitiv Datasream
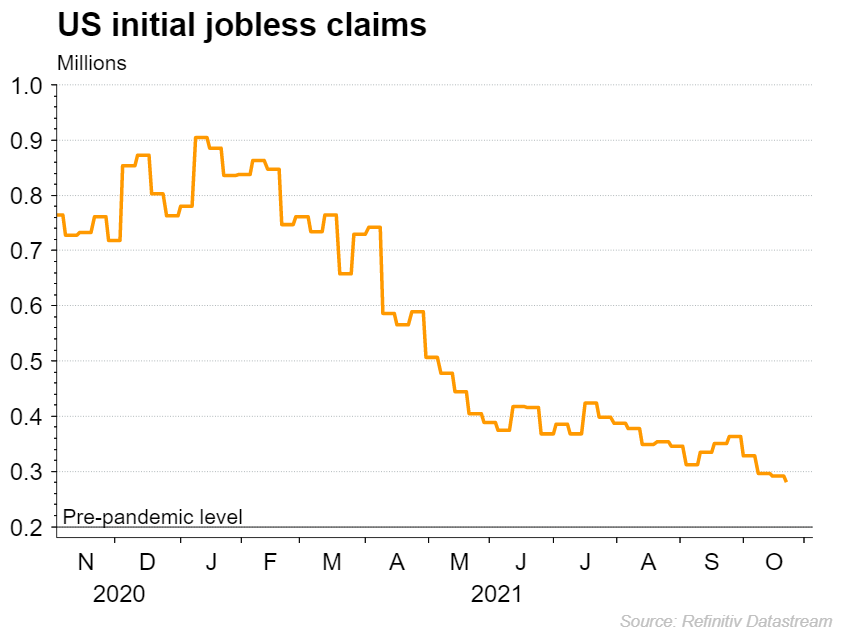
Initial jobless claims – Initial claims have continued to move lower of late, with recent weeks seeing no notable rise that could cause concern for the upcoming jobs report.
 Source: Refinitiv Datasream
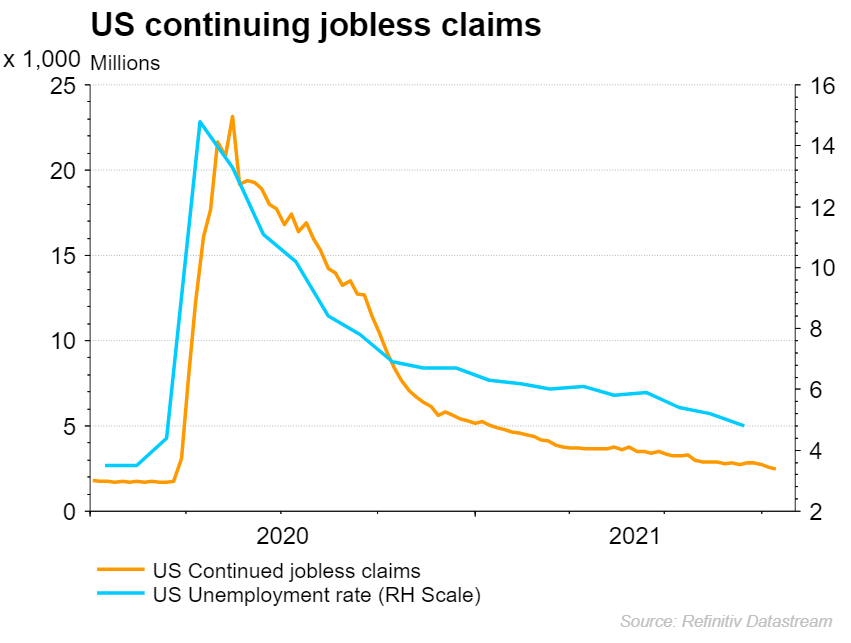
Continuing jobless claims – continuing claims provides us with a good proxy for unemployment, with the declines seen over recent weeks signalling a likely move lower for the unemployment rate.
 Source: Refinitiv Datasream
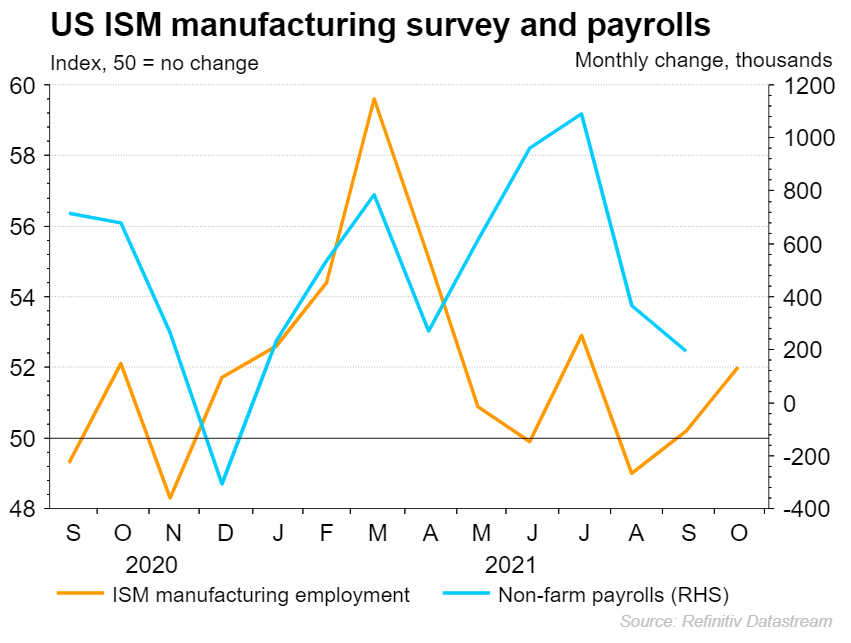
ISM manufacturing purchasing managers index (PMI) – The latest ISM manufacturing PMI saw another upward move for the employment element. A employment PMI figure of 52 signals potential improvements for Friday’s job report.
 Source: Refinitiv Datasream
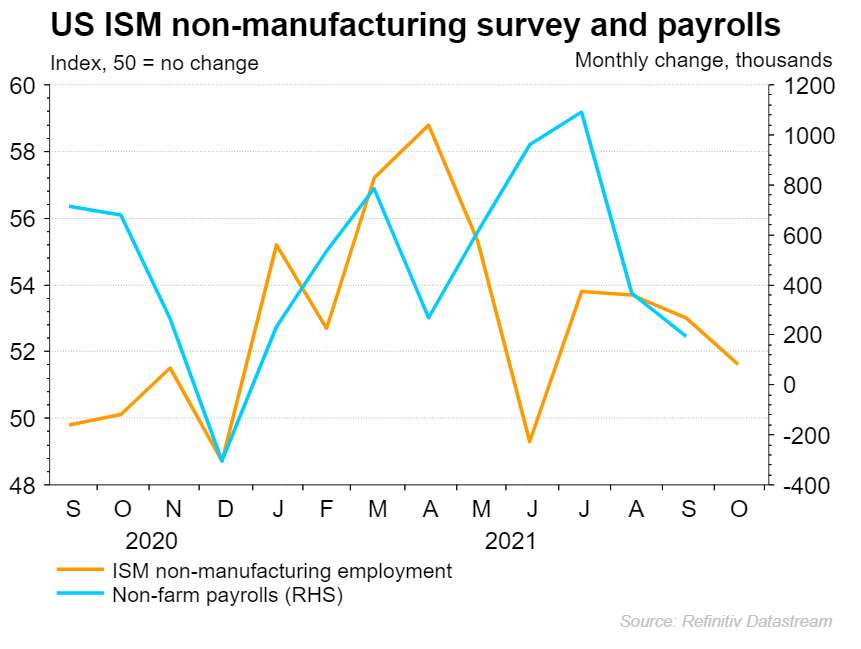
ISM non-manufacturing PMI – the services sector has shown a somewhat different story, with the ISM non-manufacturing employment PMI reading declining for October. However, we do still remain within expansion territory at 51.6, meaning we should not worry too much. Nonetheless, it does temper some of the optimism coming off the back of the manufacturing employment PMI rise.
 Source: Refinitiv Datasream
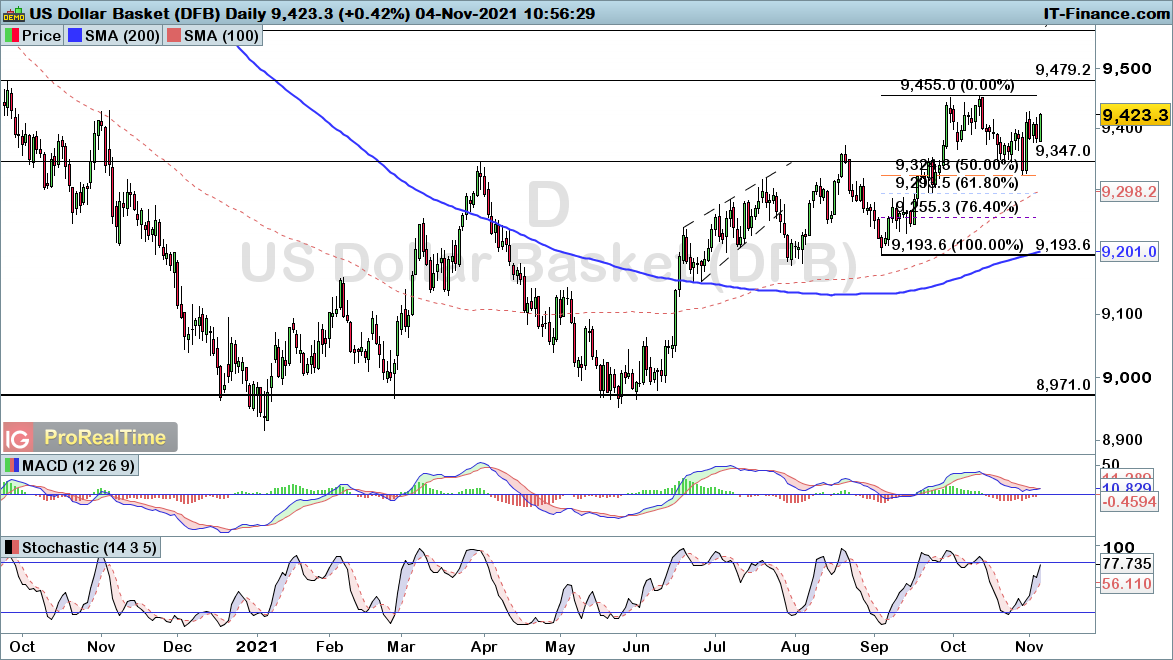
Dollar index technical analysis
The dollar has been on the rise in the wake of the FOMC rate decision yesterday. That comes off the back of a 50% retracement within October, with the wider bullish trend in play unless price breaks back below 91.93. Until then, we look likely to see the dollar continue to gain ground from here.
 Source: ProRealTime
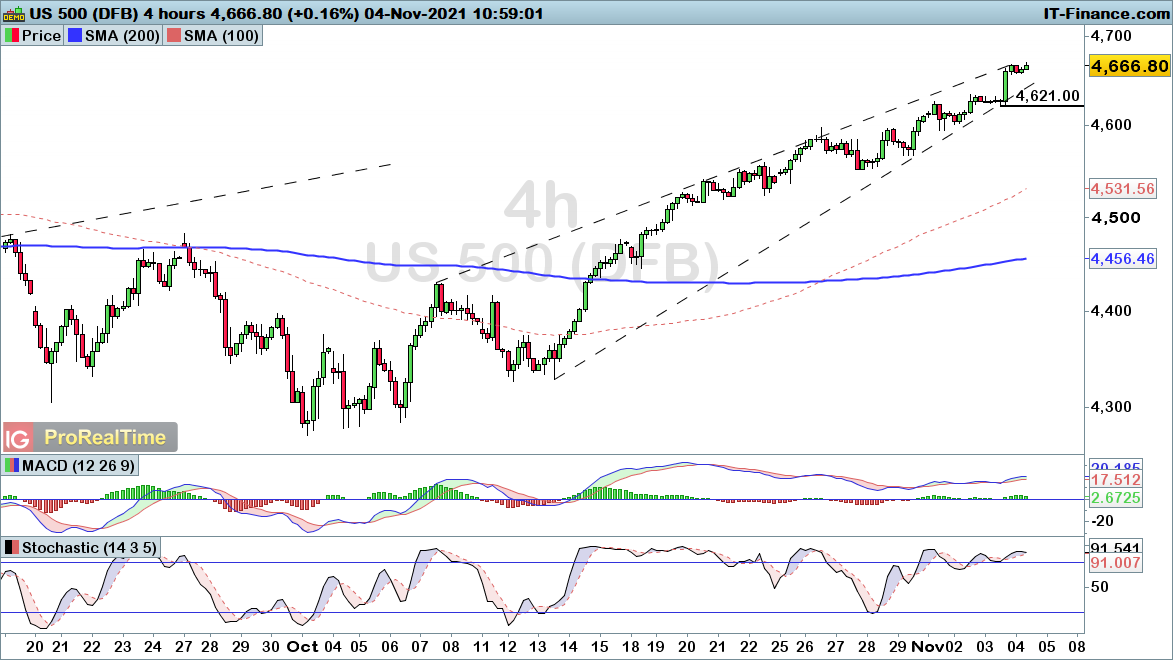
S&P 500 technical analysis
The S&P 500 has been reaching record highs on a regular basis, with today being no different. A break below the 4621 swing low would point towards a wider pullback coming into play. Until then, further upside looks likely from here.
 Source: ProRealTime


0 Comments
Recommended Comments
There are no comments to display.
Create an account or sign in to comment
You need to be a member in order to leave a comment
Create an account
Sign up for a new account in our community. It's easy!
Register a new accountSign in
Already have an account? Sign in here.
Sign In Now