US Dollar Hit as Treasury Yields Fall. Fed Warns of Risky Asset Price, Will USD Rally?

Entry posted by MongiIG in Market News
884 views
US DOLLAR, TREASURY YIELDS, USD, FEDERAL RESERVE, S&P 500 - TALKING POINTS:
- The US Dollar slipped with yields as Fed leadership change bets slightly rise.
- APAC equities and currencies were mixed with Japanese Yen outperforming.
- The Fed warned on the prices of risky assets, will USD resume its uptrend?
The US Dollar lost ground today on news that Federal Reserve Governor, Lael Brainard, was interviewed for the top job at the central bank. She is seen as more dovish than current Chair Jerome Powell. Moreover, this likely came as a surprise to markets, creating cautious uncertainty. Treasury yields softened as a result with US 10-year yields remaining below 1.50%.
Lower rates helped US equities hit another record high. The S&P 500 printed 8 straight sessions of positive gains. The best run of successive green days since 2017.
While the stock market was cheering, the Federal Reserve released their Financial Stability Report. Within their framework, they were not too concerned about borrowing by businesses and households, leverage in the financial sector or funding risks for domestic banks.
However, they did express a warning in the report on the prices of risky assets. Even allowing for low Treasury yields, they still see assets at high prices and that ‘asset prices are vulnerable to significant decline should risk appetite fall.’
The Chinese property sector also got a mention due to the size of the market and the linkages to the global economy.
APAC equities were mixed with the PBOC adding liquidity to help China and Hong Kong move slightly firmer. Australia and Japan stocks were a bit weaker.
The Australian Dollar was the underperformer on the day while the Japanese Yen found support
Looking ahead, US PPI data will be released and Federal Reserve Chair, Jerome Powell, is scheduled to speak at a joint Fed, ECB and BoC diversity conference.
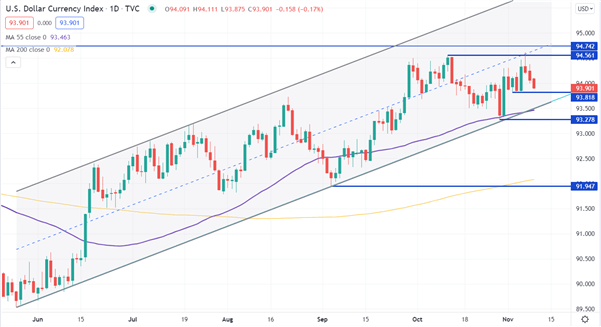
US DOLLAR (DXY) TECHNICAL ANALYSIS
The US Dollar, as represented by the USD Index (DXY), has moved lower over the last few session but remains within an ascending channel. The lower bound of the channel currently coincides with the 55-day simple moving average (SMA) at 93.463 and could provide support.
Recent lows at 93.818, 93.278 and 91.947 may see support. The later is also near the 200-day SMA, currently at 92.078.
On the topside, previous highs at 94.620 and 94.742 are potential resistance levels.
Written by Daniel McCarthy, Strategist for DailyFX.com. 9th November 2021.


.jpg.27c55ea07d5a17683fbdbda06b8fcace.jpg)
0 Comments
Recommended Comments
There are no comments to display.
Create an account or sign in to comment
You need to be a member in order to leave a comment
Create an account
Sign up for a new account in our community. It's easy!
Register a new accountSign in
Already have an account? Sign in here.
Sign In Now