USD/ZAR Forecast: Friday’s Omicron Overshoot Sees Rand Open Higher

Entry posted by MongiIG in Market News
1,448 views
RAND ANALYSIS:
- Rand market frenzy fades as market mulls over new variant.
- Commodities revised lower as uncertainty emerges.
- Bearish harami suggests short-term USD/ZAR downside correction.
ZAR FUNDAMENTAL BACKDROP
RAND IS NOW ONE OF THE WORST PERFORMING CURRENCIES AGAINST THE GREENBACK
The South African rand may have been the worst affected Emerging Market (EM) currency as a result of the new COVID-19 strain known as Omicron. Inaccurate news about the virus sourcing from South Africa has led to the significant selloff last week. Although the selloff was systemic, with only a handful of safe-haven assets (gold, JPY, CHF and U.S. Treasuries) seeing any upside at all, the ZAR took the brunt of the move. Downside was compounded by the travel bans imposed by many foreign countries which seemed to have a domino-like effect once initiated. The rand once stood as the best performing currency against the U.S. dollar earlier this year but now sits around the bottom of the pile almost 10% down for the year (see graphic below):
CURRENCIES VS U.S. DOLLAR YTD:
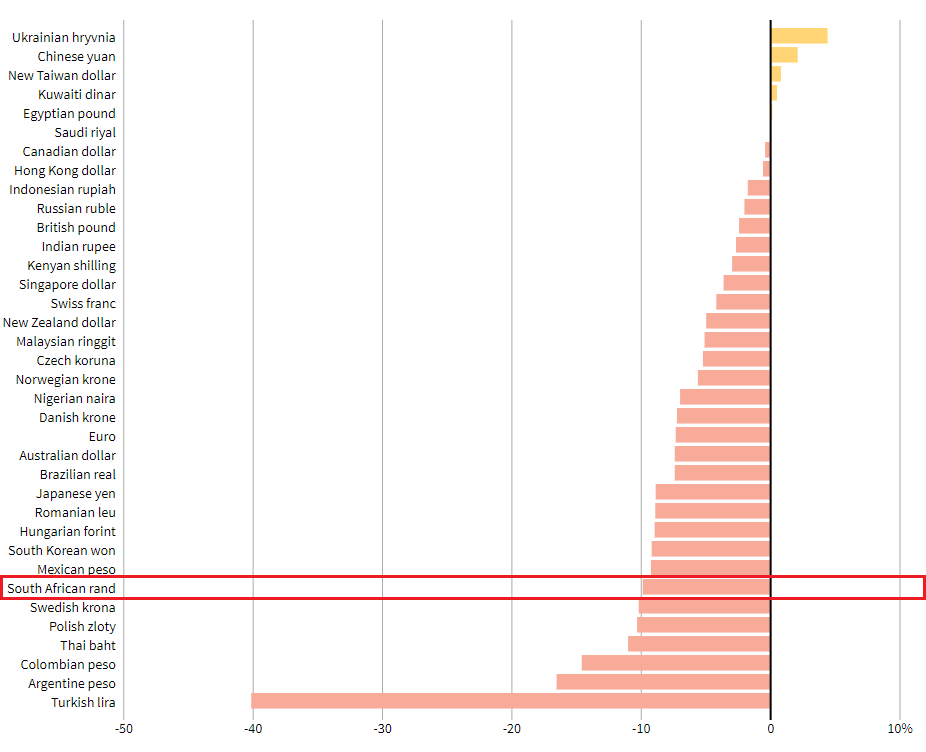
Source: Reuters
Last night, South Africa’s President Cyril Ramaphosa addressed the nation outlining the new variant and its possible ramifications should citizens not take necessary precautions. He went on to express his displeasure towards countries that have executed the aforementioned travel bans which went against prior G20 discussions (according to the president). Travel will severely curtail the already struggling tourism sector and could take a toll on the rand should it remain until year end.
Commodities continue to feel the pinch this week as demand forecasts are negatively impacted (particularly oil), but rand linked commodities have been buoyed somewhat by the recent uptick in iron ore.
SOUTH AFRICA 10-YEAR GOVERNMENT BOND YIELD:
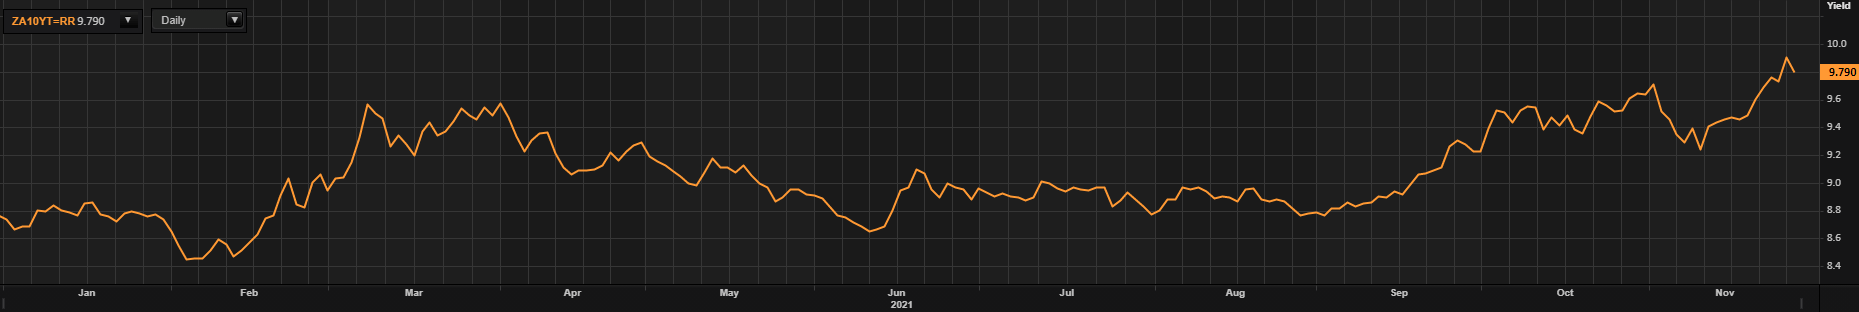
Source: Refinitiv
South African 10-year government bond yields hit fresh yearly highs last week reflecting the significant bond selloff and risk aversion. Although markets have marginally rebounded today, the short/medium-term remains uncertain as markets await more data on the new strain.
UPCOMING ECONOMIC DATA THIS WEEK
The week ahead is riddled with high impact U.S. focused events that could enhance the Fed’s increasingly hawkish slant. Firming economic growth as a result of PMI and NFP beats will play into the hands of hawks and could exacerbate the current ZAR slump.
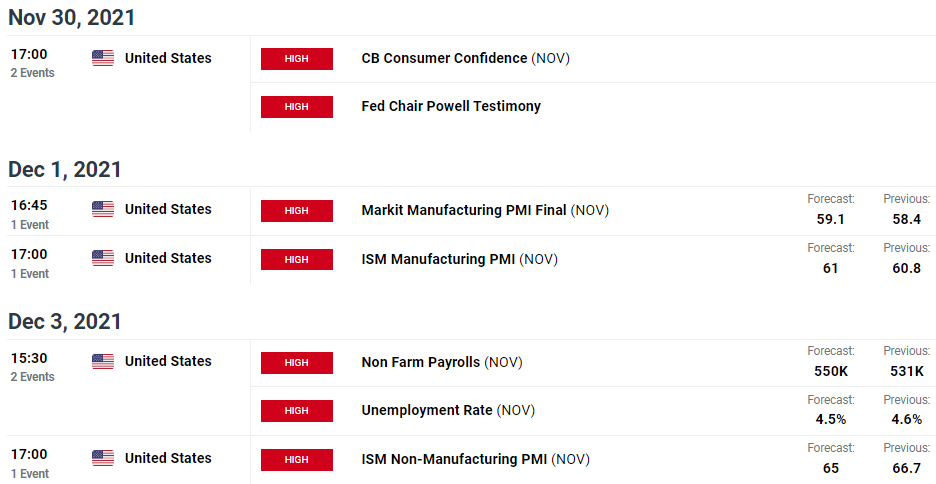
Source: DailyFX economic calendar
From the South African perspective, the events listed below with particular focus on unemployment tomorrow could be potential market movers.
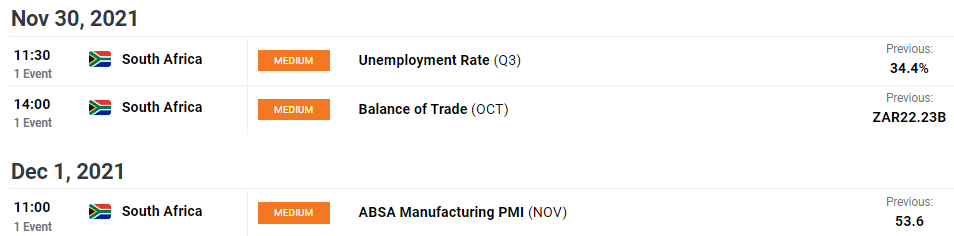
Source: DailyFX economic calendar
TECHNICAL ANALYSIS
USD/ZAR DAILY CHART
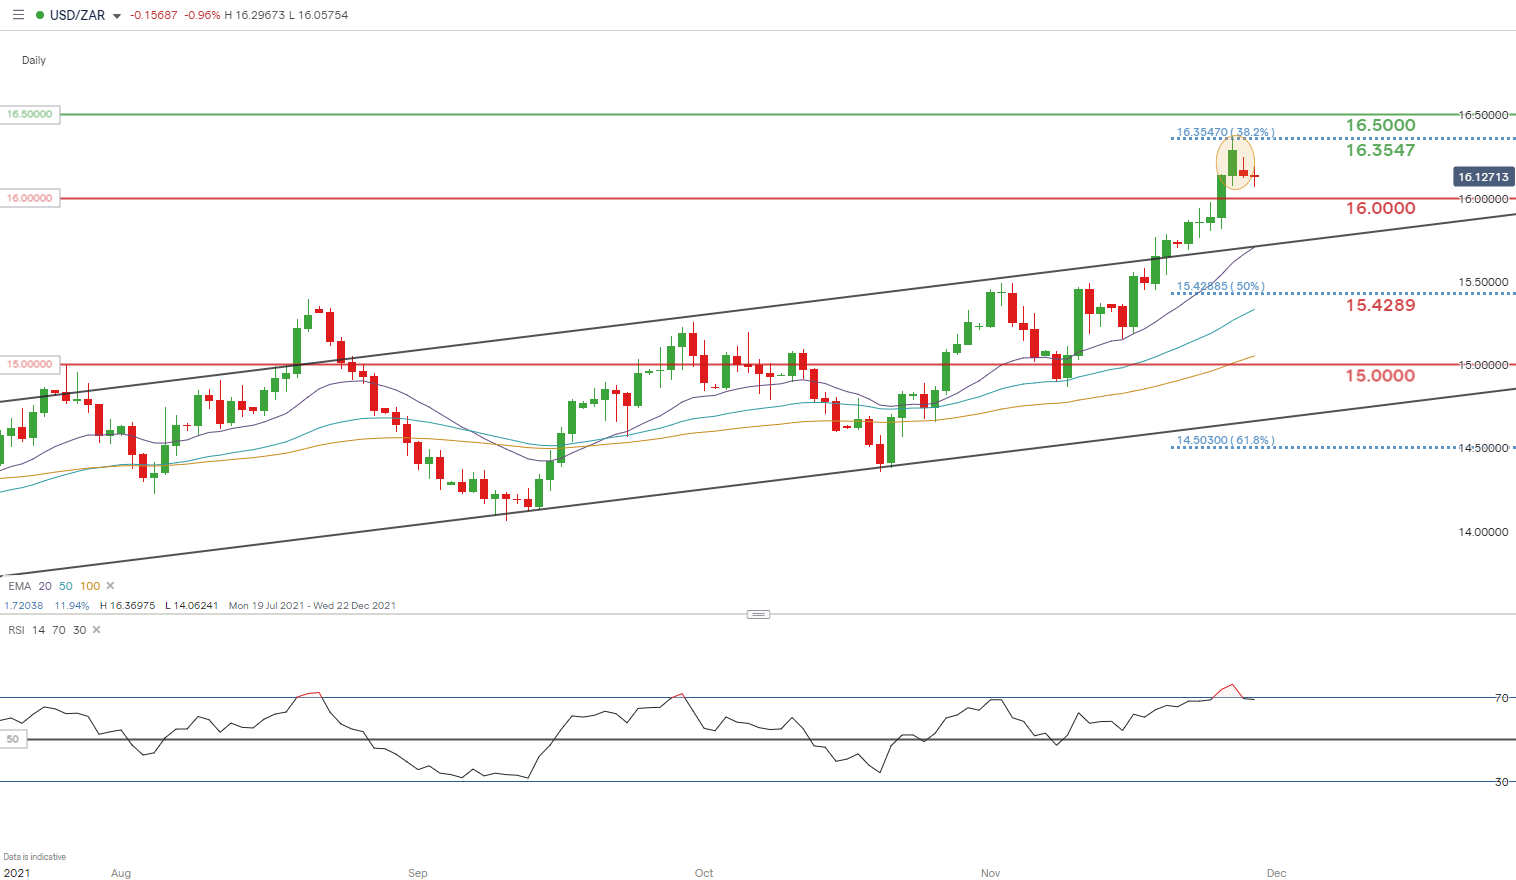
Chart prepared by Warren Venketas, IG
The 38.2% Fibonacci at 16.3547 proved to be a key level of resistance with profit taking seen around this area of confluence, last seen during the October/November 2020 period. The bearish harami candlestick pattern (yellow) gave some inclination for todays move lower and could continue (data dependent) lower to 16.0000 psychological level where many may look to re-enter long.
The Relative Strength Index (RSI) is currently overbought, commensurate with the above price action but firmly favors an upside bias.
Resistance levels:
- 16.5000
- 16.3547 – 38.2% Fibonacci level
Support levels:
- 16.0000
- 20-day EMA (purple)/channel resistance
- 15.4289 – 50% Fibonacci level
by Warren Venketas, Analyst, 29th November 2021. DailyFX


0 Comments
Recommended Comments
There are no comments to display.
Create an account or sign in to comment
You need to be a member in order to leave a comment
Create an account
Sign up for a new account in our community. It's easy!
Register a new accountSign in
Already have an account? Sign in here.
Sign In Now