British Pound (GBP) Price Outlook: GBP/USD Challenging Support

Entry posted by MongiIG in Market News
771 views
GBP/USD price, news and analysis:
- GBP/USD weakness looks set to continue as the financial markets remain jittery after news that the first case of the Omicron variant of Covid-19 in the US has been found, suggesting it is still spreading.
- A hawkish Federal Reserve chair, who has reiterated that a faster taper of US stimulus than previously expected is now on the cards, is not helping either.
GBP/USD weakness may persist
GBP/USD is continuing to slip back within a downward-sloping channel on the hourly chart (see below) that has been in place for the past fortnight. Moreover, it is now sitting on the support line of a longer-term channel on the daily chart, and if it breaks through then further losses are likely, perhaps to the 1.32 level initially.
GBP/USD Price Chart, Hourly Timeframe (November 17 – December 2,
2021)
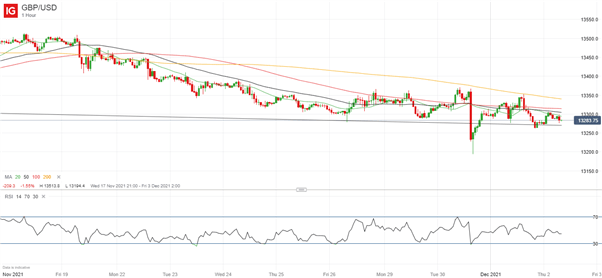
Source: IG (You can click on it for a larger image)
Omicron jitters, hawkish Fed
Behind the weakness in GBP/USD lie fears that the Omicron variant of the coronavirus is still spreading. The first case in the US has now been discovered, and that has knocked back risk sentiment throughout the financial markets.
Moreover, Federal Reserve Chair Jay Powell seems to be taking a more hawkish view of US monetary policy, reiterating Wednesday that the Fed will likely taper policy faster than previously expected now that it has dropped the word “transitory” from its view of inflation.
The central bank will therefore consider a faster tapering of its bond-buying program when it meets on December 14/15, and that could lead to earlier interest rates increases. Cleveland Fed President Loretta Mester indicated in an interview Wednesday that she expects two 25 basis point hikes next year.
Retail traders net long GBP/USD
Turning to positioning, the latest IG client sentiment figures show that a large majority of retail traders remain long the pair. The data show 74.22% of traders are net-long, with the ratio of traders long to short at 2.88 to 1. The number of traders net-long is 3.80% higher than yesterday though 9.62% lower than last week, while the number of traders net-short is 2.84% higher than yesterday but 9.52% lower than last week.
Here at DailyFX, we typically take a contrarian view to crowd sentiment, and the fact traders are net-long suggests GBP/USD may continue to fall. However, positioning is more net-long than yesterday but less net-long than last week, and the combination of current sentiment and recent changes gives us no clear GBP/USD trading bias either way.
Written by Martin Essex, Analyst, 2nd December 2021. DailyFX


.jpeg.98f0cfe51803b4af23bc6b06b29ba6ff.jpeg)


0 Comments
Recommended Comments
There are no comments to display.
Create an account or sign in to comment
You need to be a member in order to leave a comment
Create an account
Sign up for a new account in our community. It's easy!
Register a new accountSign in
Already have an account? Sign in here.
Sign In Now