British Pound (GBP) Price Outlook: Downside Pressure on GBP/USD Persists
GBP/USD PRICE, NEWS AND ANALYSIS:
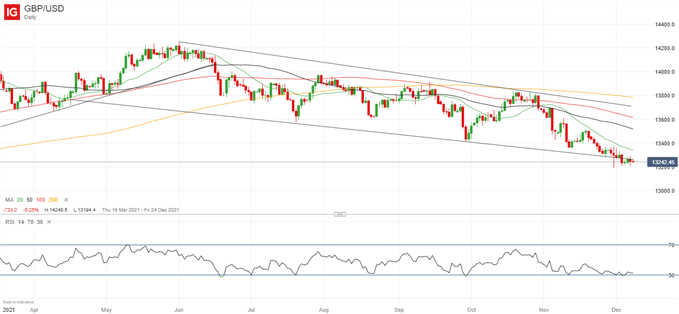
- GBP/USD continues to hover around the support line of a downward-sloping channel connecting the lower lows in place since mid-April.
- So far it has notably failed to benefit from receding fears about the Omicron variant of the coronavirus and it looks increasingly likely that the previous support line is now acting as resistance.

GBP/USD DOWNSIDE BECKONS
GBP/USD is continuing to struggle to climb above the support line of a downward-sloping channel on the daily chart that has been in place since April 16 and that support line is now increasingly looking like resistance, suggesting that once the current period of consolidation is over, GBP/USD will fall further.
This failure to rally has come against some optimism that the Omicron variant of Covid-19 will fail to cause as much damage as once feared.
GBP/USD PRICE CHART, DAILY TIMEFRAME (APRIL 12 – DECEMBER 8, 2021)
Source: IG (You can click on it for a larger image)
OMICRON RELIEF
A small South African study showed that antibodies from the Pfizer vaccine may be up to 40 times less effective against Omicron than the original Covid strain. However, booster jabs may make up the difference and earlier a spokesperson for BioNTech, which developed its vaccine with Pfizer, said they believe that fully vaccinated people will have a high level of protection against severe disease caused by Omicron.
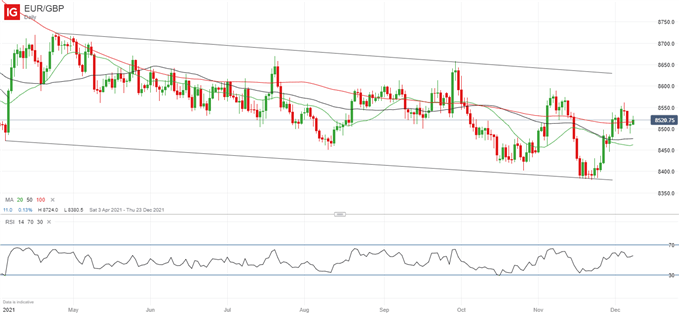
That has helped lift traders’ mood but GBP has largely failed to benefit, as can be seen in the chart below of EUR/GBP.
EUR/GBP PRICE CHART, DAILY TIMEFRAME (APRIL 5 – DECEMBER 8, 2021)
Source: IG (You can click on it for a larger image)
RETAIL TRADER DATA BEARISH GBP/USD
Turning to the IG positioning figures, the latest retail trader data show 74.90% of traders are net-long GBP/USD, with the ratio of traders long to short at 2.98 to 1. The number of traders net-long is 5.63% higher than yesterday and 10.29% higher than last week, while the number of traders net-short is 7.48% lower than yesterday but 5.41% higher than last week.
Here at DailyFX, we typically take a contrarian view to crowd sentiment, and the fact traders are net-long suggests GBP/USD prices may continue to fall. Moreover, traders are further net-long than yesterday and last week, and the combination of current sentiment and recent changes gives us a stronger GBP/USD-bearish contrarian trading bias.
Written by Martin Essex, Analyst, 8th December 2021. DailyFX


0 Comments
Recommended Comments
There are no comments to display.
Create an account or sign in to comment
You need to be a member in order to leave a comment
Create an account
Sign up for a new account in our community. It's easy!
Register a new accountSign in
Already have an account? Sign in here.
Sign In Now