British Pound Technical Analysis: GBP/USD, GBP/JPY at Major Support

Entry posted by MongiIG in Market News
749 views
BRITISH POUND, GBP, GBP/USD, GBP/JPY TALKING POINTS:
- The British Pound has been abysmally weak, allowing for both GBP/USD and GBP/JPY to encroach upon major support zones.
- While such support would often be accommodative of reversal approaches, the fact that GBP has shown so few signs of life recently would keep the door open for deeper breakdown prospects, particularly in GBP/JPY.
- The analysis contained in article relies on price action and chart formations. To learn more about price action or chart patterns, check out our DailyFX Education section.

The British Pound remains as one of the weakest currencies in the world, and this comes despite expectations for rate hikes in early-2022. In early-November, there were even expectations for a rate hike at the Super Thursday rate decision. At the time, GBP/USD was holding resistance at a confluent spot on the chart, where a Fibonacci level intersected with the topside of a bull flag formation.
When the BoE didn’t hike at that meeting, the pair began to fall and, frankly, that hasn’t yet stopped. GBP/USD has now fallen by more than 650 pips in under two months and a major area of support is now coming into play.
Price action in GBP/USD is now testing the bottom portion of that bull flag formation which is confluent with a 38.2% Fibonacci retracement taken from the 2020-2021 recovery move. This is also a fresh 2021 low in the pair which syncs up with a price action swing from last December, taken from around 1.3188.
GBP/USD WEEKLY PRICE CHART

Chart prepared by James Stanley; GBPUSD on Tradingview
From the daily price chart, we can see where the sell-off has started to slow as this support has come into play. This is what leads into falling wedges being formed, which can prelude reversals. And normally, given this backdrop, the reversal would be an attractive way of moving forward and that can certainly remain as a possibility.
The primary challenge here is that buyers have had ample opportunity over the past two weeks to bid this higher and they haven’t. This continued sell-off has shown even as EUR/USD put in a reversal move yesterday and that follows reversal moves in commodity currency pairs like USD/CAD and AUD/USD earlier in the week. Through it all, sellers continued to push in GBP/USD, which keeps the door open for breakdown scenarios in the pair.
GBP/USD DAILY PRICE CHART
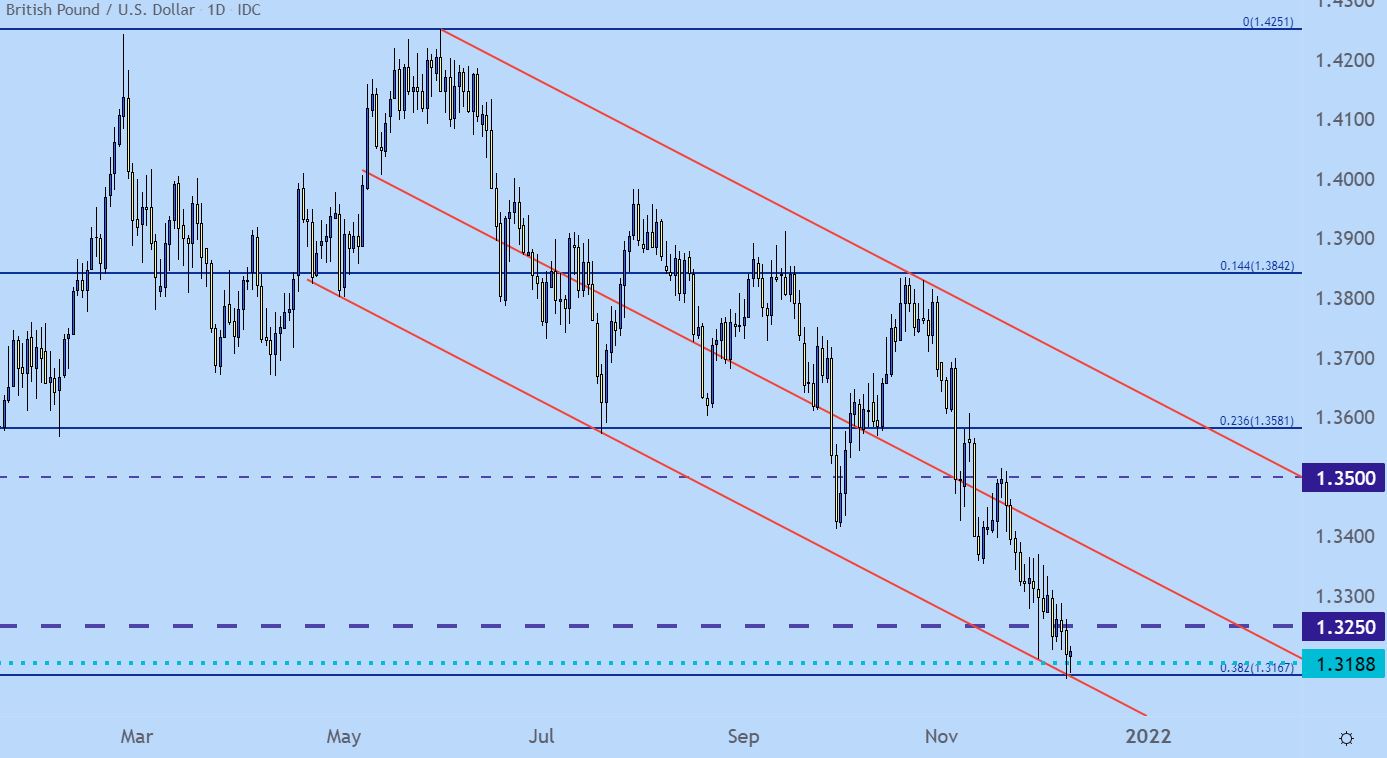
Chart prepared by James Stanley; GBPUSD on Tradingview
GBP/USD SHORTER-TERM
The four-hour chart is where reversal prospects can start to come into play, but this would be contingent on current support holding. Falling wedge formations can often prelude bullish reversals and they’ll often form around major spots of support. After all, if we’re seeing sellers slow around lows, there’s often a reason for it. And if the support remains strong enough, eventually, it may help to offset order flow enough to allow for a higher-high to break the sequence of recent lower-highs, and this can open the door to a reversal similar to what showed in USD/CAD in mid-October.
GBP/USD TWO-HOUR PRICE CHART
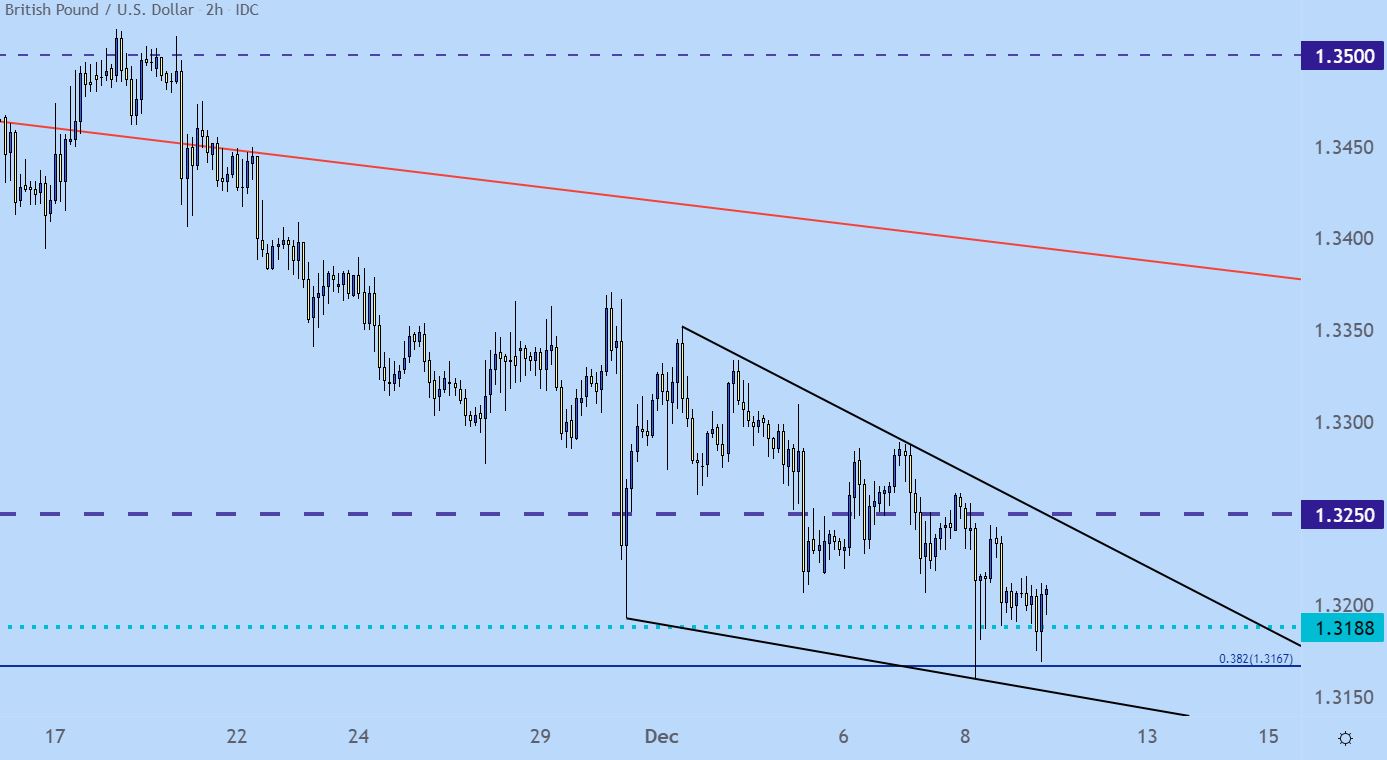
Chart prepared by James Stanley; GBPUSD on Tradingview
GBP/JPY: LOOK OUT BELOW
Similarly in GBP/JPY, that British Pound weakness is on full display. For much of this year, GBP/JPY has consistently found support at a spot on the chart running from 148.53-149.07. This area acted like a springboard ahead of the Q4 open, leading to an 800+ pip run in the currency as rates drove Yen-weakness, and that was combined with aspirations of BoE rate hikes which helped to drive GBP-strength.
That entire theme has now fallen flat, and prices have quickly reverted back to this key support zone. The momentum with which price action has returned to this zone is what makes it vulnerable, and while the past week-and-a-half has seen a build of support around this zone, buyers haven’t exactly been able to do much with that yet, even yesterday when Yen-weakness made a re-appearance in a number of other pairs.
For this zone to give way, we’ll likely need to see some large-scale risk aversion enter the picture, which given the slate of events for the week ahead remains a possibility. Tomorrow brings CPI out of the US, with next week’s FOMC and a pretty significant option expiry next Friday. While none of these are directly pertinent to GBP or JPY, the overall macro tones certainly are, and if risk aversion shows from this bag of risk on the horizon, the bottom side of the pair could fall out in short order.
GBP/JPY DAILY PRICE CHART
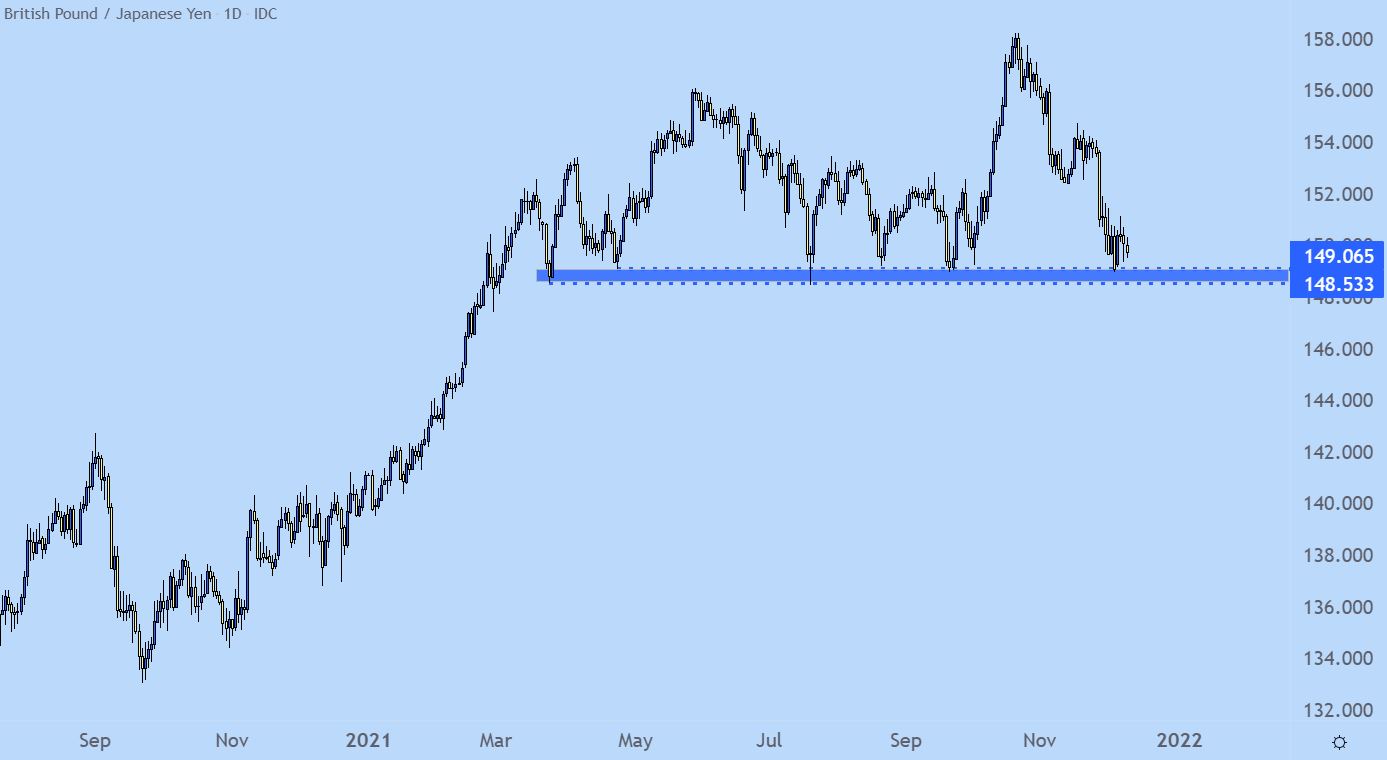
Chart prepared by James Stanley; GBPJPY on Tradingview
Written by James Stanley, Senior Strategist for DailyFX.com. 9th December 2021.


0 Comments
Recommended Comments
There are no comments to display.
Create an account or sign in to comment
You need to be a member in order to leave a comment
Create an account
Sign up for a new account in our community. It's easy!
Register a new accountSign in
Already have an account? Sign in here.
Sign In Now