US Dollar outlook for 2022

Entry posted by MongiIG in Market News
1,440 views
The below commentary highlights some of the key factors affecting US monetary policy which should in turn dictate future price movements for the US dollar.
 Source: Bloomberg
Inflation no longer considered ‘transitory’
US policy makers have been targeting an inflation rate of 2% in terms of the Fed’s statutory mandate towards ‘price stability’ in the marketplace. The Price Index for Personal Consumption Expenditures (PCE) remains a key metric in determining inflation and has been soaring significantly above the Fed’s target. July, August, September, and October PCE figures have indicated year on year inflation at 4.1%, 4.2%, 4.4% and 5% respectively. These figures, which track significantly higher than the bank’s target rate, have been rising as supply chain disruptions and rising energy prices meet increased demand through an economic recovery despite the ongoing pandemic.
Persistently high and still rising inflation has seen Federal Reserve Bank (The Fed) Chairperson Jerome Powell and Treasury Secretary (former Fed Chair) Janet Yellen dropping the word ‘transitory’ from communications when referring to inflation i.e., the rise in inflation is no longer thought to be temporary in nature.
High inflation provides pressure towards the tightening of US monetary policy.
Employment a mixed picture
In addition to price stability, the Federal Reserve’s dual mandate strives for maximum employment, defined as ‘the highest level of employment or lowest level of unemployment that the economy can sustain while maintaining a stable inflation rate.”
November 2021 saw the unemployment rate drop to 4.2%, not far off the pre-covid levels witnessed at the beginning of 2020 (3.5%). But while the unemployment rate has been steadily improving since the May 2020 blowout, recent non-farm payroll data (for November 2021) has suggested that the speed at which jobs are being generated is slowing.
Tapering could see bond buying programme ending sooner
Fed Chairperson Jerome Powell has recently (in a Congressional Testimony) indicated that tapering the current asset purchasing programme could start to occur at a faster pace than originally anticipated. The bond-buying programme originally expected to be phased out by mid-2022, could in fact now end in March 2022 instead.
The end of these stimulus efforts would in turn make way for the Fed to focus on the timeline towards normalizing interest rates.
When will lending rates in the US rise?
The current Federal Funds rates are within the 0% to 0.25% range. At the time of writing (6 December 2021) the implied probabilities (as sourced from the CME Fed Watch Tool) for the target rate at upcoming Federal Reserve Open Market Committee (FOMC) meetings is as follows:
| Target rate (%) | Probability (%) | ||||
|---|---|---|---|---|---|
|
|
26 Jan |
16 Mar |
4 May |
15 Jun |
27 Jul |
|
0 - 0.25% (Current) |
92.60% |
71.30% |
53.60% |
26.40% |
18.30% |
|
0.25 - 0.5% |
7.40% |
26.90% |
40.50% |
44.50% |
38.80% |
|
0.50 - 0.75% |
|
1.70% |
9.50% |
24.10% |
30.40% |
|
0.75 - 1.00% |
|
|
0.50% |
4.80% |
10.80% |
|
1.00 - 1.25% |
|
|
|
0.20% |
1.70% |
Currently it appears that the Fed Funds Rate is likely to move higher by 25 basis points (0.25%) at either the May or June 2022 meeting.
The threat of Omicron and new Covid variants
While not enough is known about the Omicron variant of Covid at the time of writing (6 December 2021), new waves of the pandemic do provide economic and in turn policy uncertainty.
On one hand the threat of supply chain bottlenecks prolongs inflationary concerns, although on the other hand the ongoing virus could hamper economic growth, demand and in turn soften future inflation outcomes as well.
On balance, the 4th wave of the pandemic has begun and has not deterred the more hawkish commentary from policy makers such as Jerome Powell and Janet Yellen.
The dollar set to strengthen?
As it currently stands, the nearing end of US bond purchasing programmes, precede what appears to be the imminent rising of lending rates in the world’s largest economy. The expectation of when rates will rise is slowly being brought forward, supported by more hawkish commentary from policy makers, through persistent levels of inflation and improving unemployment levels (on balance).
While this presents a case for dollar appreciation we need to consider the path of monetary policy for currencies with which it is crossed.
The EUR/USD
Supply chain disruptions and soaring energy costs have pushed inflation well above the 2% European Central Bank (ECB) target, to reach a multi-decade high in November 2021 (4.9%). The ECB will also be pondering on the best approach to offsetting high inflation against the economic threat of another covid variant.
The central bank remains committed to ending its Pandemic Emergency Purchasing Programme (PEPP) by March 2022. However, ECB Chairperson Christine Lagarde has suggested keeping lending rates on hold in 2022 although options remain open and data dependent. Current suggestions are that the ECB could start to normalize rates in the fourth quarter of 2022, leaving the bank slightly behind the interest rate curve expected in the US.
 Source: IG Charts
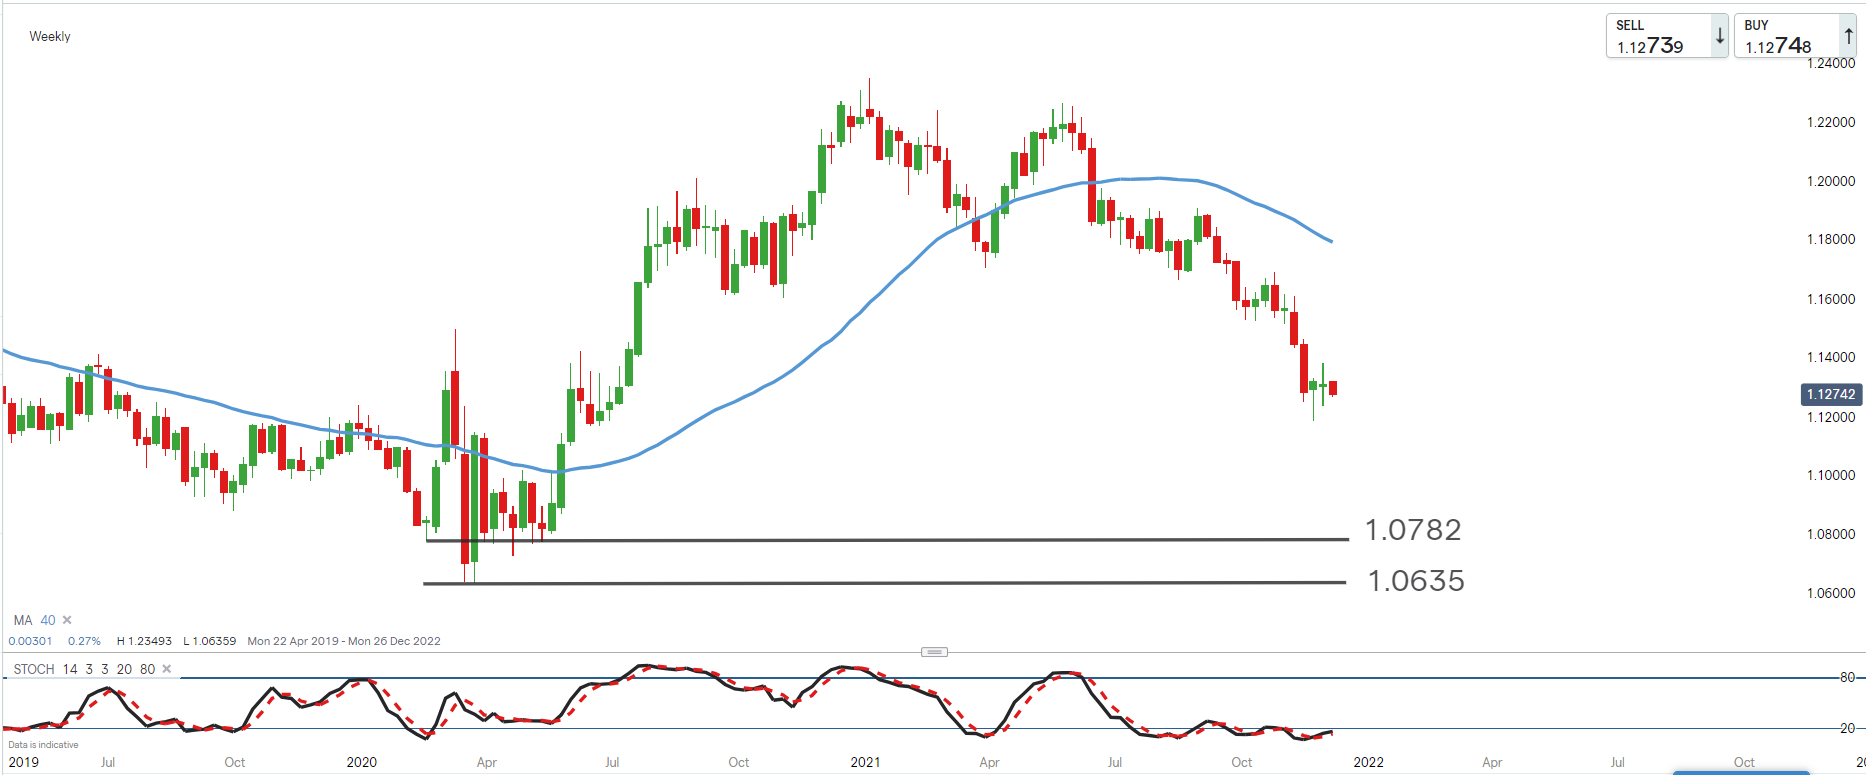
A weekly chart of the EUR/USD shows the long-term trend to be down (EUR weakness / USD strength) as the price trades firmly below the 40 week simple moving average (equivalent of 200 day simple moving average).
The downtrend remains favoured provided that the price remains below the 40-week moving average (blue line). In this situation longer term support targets for the currency pair are considered at the 1.0782 and 1.0635 levels respectively.
GBP/USD
The Bank of England (BOE) is expected to be ahead of the curve in terms of looking to tackle inflation, with a possible tightening of monetary policy at December’s Monetary Policy Committee (MPC) meeting. If not however, two interest rate hikes for 2022 are expected which could still see Stirling showing some relative resilience against the US Dollar. Some further supportive economic data would forecast improvements in the region’s twin deficits (budget and current account).
 Source: IG Charts
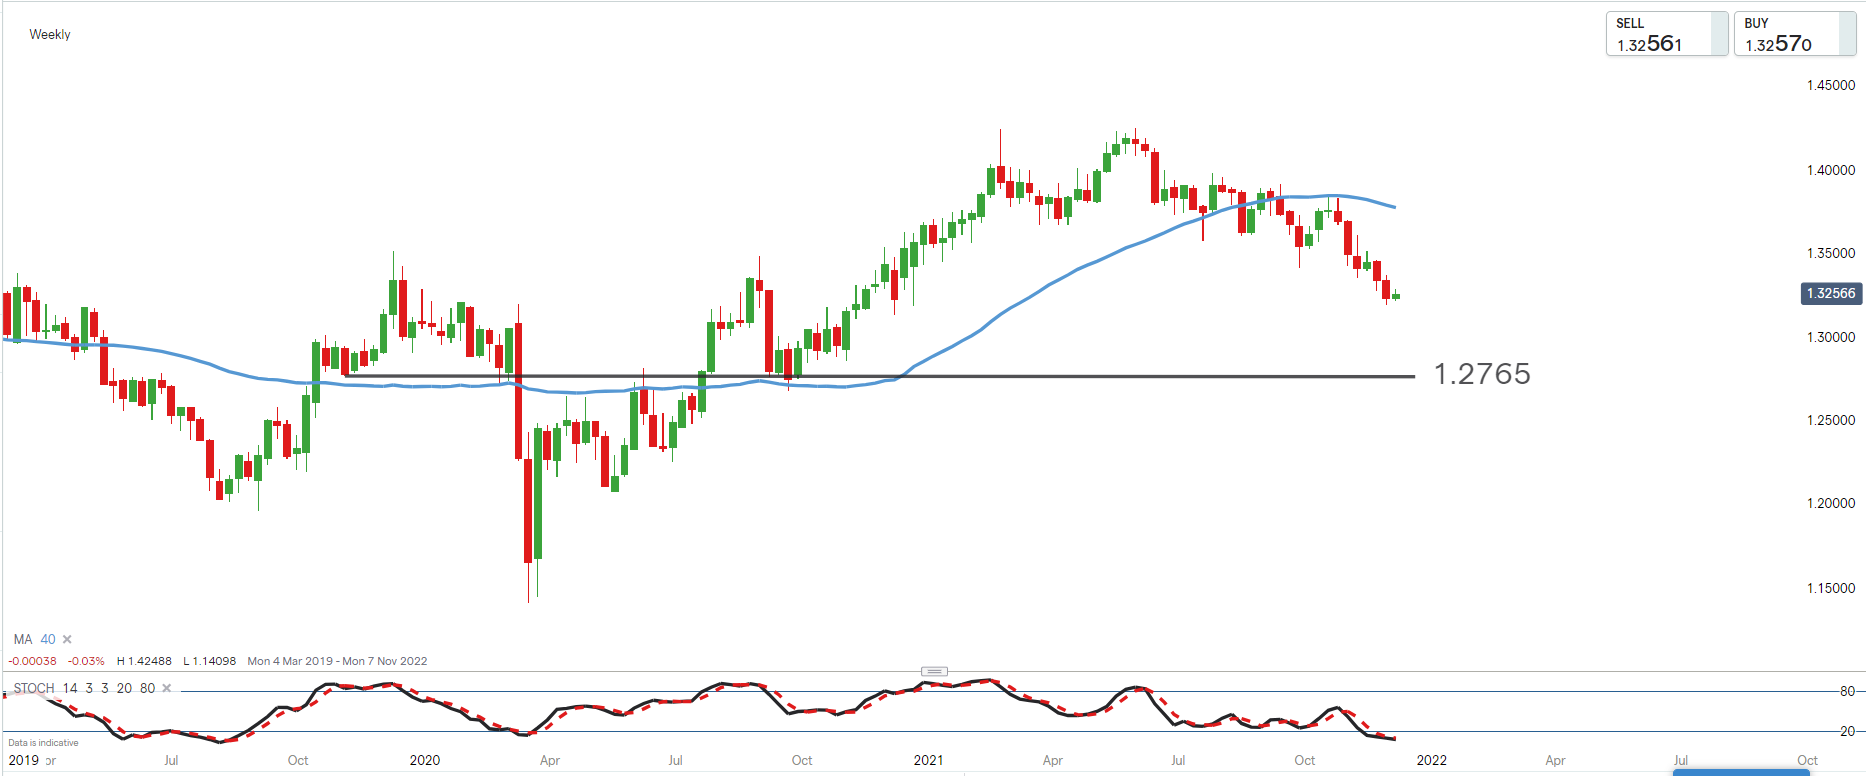
The weekly chart of cable (GBP/USD) does however resemble (although less pronounced) that of the EUR/USD chart. The price trades below the 40-week moving average suggesting the long term trend bias to remain down (GBP weakness / USD strength).
1.2765 becomes the longer-term downside support target favoured up until such time as we see the price back above the 40 week moving average (blue line).
USD/JPY
Stubbornly low inflation in Japan puts the region behind the curve particularly against the US in terms of when monetary policy will tighten. Should the current energy crisis start to show some signs of relief it could mar the inflation outlook further. The Bank of Japan has also recently lowered its economic growth forecasts on weak consumption and the impact of supply disruptions on industrial output. In turn this suggests a stronger dollar relative to the Japanese Yen over the medium term.
 Source: IG Charts
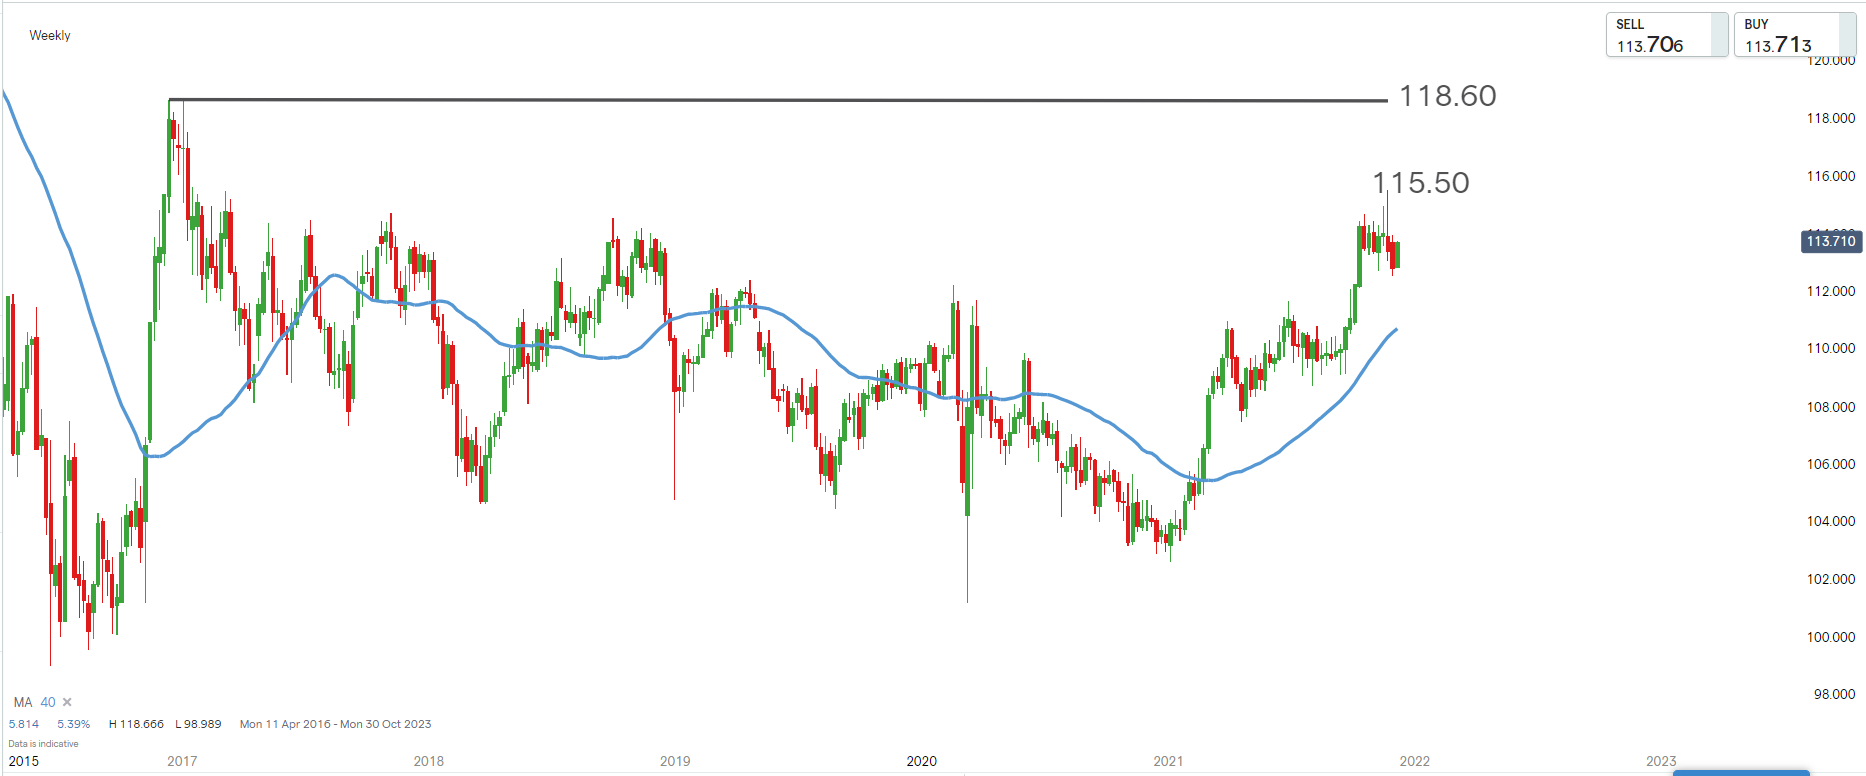
The USD/JPY continues to trade in a firm uptrend as highlighted by the price trading firmly above the 40-week simple moving average (blue line).
Provide that the weekly price of the currency pair trades above the 40-period moving average 115.60 becomes the initial upside target from the move. A break above this level sees 118.60 as a further longer term upside target for the USD/JPY.

.jpeg.98f0cfe51803b4af23bc6b06b29ba6ff.jpeg)
.jpeg.573e1479f76cb6c02faab8d9bd670ff8.jpeg)

0 Comments
Recommended Comments
There are no comments to display.
Create an account or sign in to comment
You need to be a member in order to leave a comment
Create an account
Sign up for a new account in our community. It's easy!
Register a new accountSign in
Already have an account? Sign in here.
Sign In Now