What Drives the Dollar, Breaks the Nasdaq 100 in Quiet Before FOMC Storm?
QQQ NASDAQ 100 ETF, FED FORECAST, DOLLAR, USDJPY AND EARNINGS TALKING POINTS
- Risk appetite is still elevated at the upper end of the spectrum, but the correction for the likes of the Nasdaq 100 and S&P 500 create a backdrop of instability
- To determine where the markets are heading over the coming week, it is worthwhile to assess the dominant fundamental drive – and Fed speculation will recede this week
- Aside from US monetary policy, China’s 4Q GDP release is top scheduled event risk, US earnings seasonal will fill out and there are some other rate speculation outlets

RISK ASSETS FLIRT WITH YOUR EMOTIONS
Are risk appetite trends holding steadfast to their years-long bull trend or are there potentially fatal tremors that we should be concerned about? Depending on who you ask, the answer to that question will differ substantially. If you are looking for a reliable overall trend, it should be far more straightforward when assessing a bullish or bearish view on the financial system. Underlying sentiment trends wouldn’t exactly signal a systemic tide that precedes fundamental motivation through this past week, and the thematic focus for the week ahead is facing notable headwinds. In particular, US monetary policy will be wholly dependent on speculation with the US economic docket thinning out (for rate sensitive updates) and the Federal Reserve moving into the media blackout period before its next policy announcement – on January 26th. Taking stock of the speculative benchmarks, the QQQs, the heavily traded Nasdaq 100 ETF, has further eroded the sanctity of range and trend-channel support with price action on Friday that was as disruptive as what we witnessed on Monday. If you referred to this highly-amplified speculative index alone, you would conclude that the floor has already dropped out. That said, in judging a systemic reversal, the evidence should run deeper than a single barometer.
Chart of QQQ Nasdaq 100 ETF with 100, 200-Day SMA and Volume (Daily)
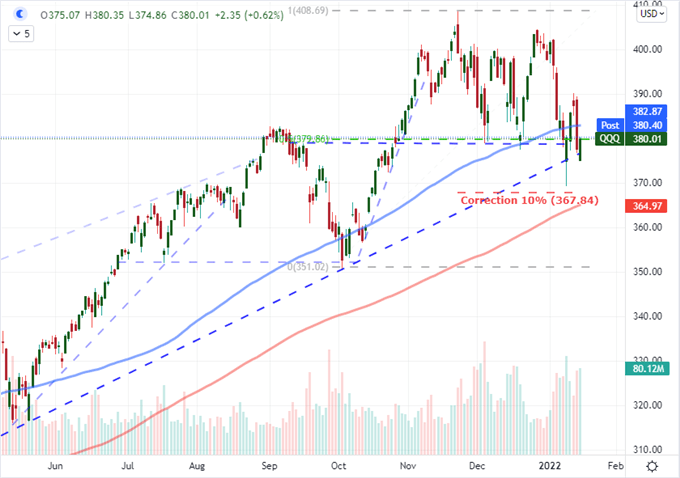
Chart Created on Tradingview Platform
In contrast to the QQQs which have twice plunged – on an intraday basis – below very overt technical support, the SPDR S&P 500 ETF (SPY) has very explicitly held the line on its own long-running floor. There is a healthy debate to be had over which is more indicative of the market; but if you are looking for something as remarkable as a full bearish reversal, I think it would make sense to wait until both measures are signaling for the bears before making a call. It is a fairly low boundary to wait until a break of 4,600 or 4,550 is registered by the S&P 500 before throwing in with a bearish run. However, if you really wanted to raise the speculative requirement on the market, a comprehensive correlation and momentum across international equities, junk bonds, emerging market assets, carry trade and speculative commodities would truly carry the weight of conviction. Establish your risk sensitivity and then determine how many of these milestones you need to check off before throwing in with a turn of market.
Chart of the SPDR S&P 500 ETF with 100-Day Moving Average and Volume (Daily)
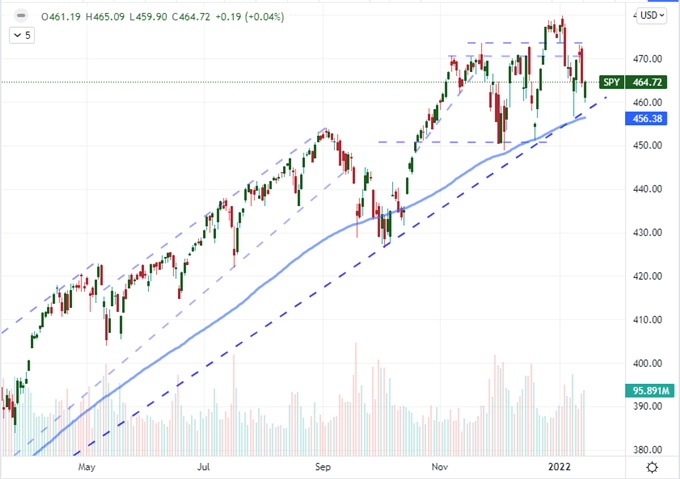
Chart Created on Tradingview Platform
WE HAVE A PROBLEM WITH FED SPECULATION LEADING THE WAY THIS WEEK
With benchmark measures of ‘risk appetite’ on the cusp of systemic shift in trend, it is useful to find a fundamental lead to carry the market to a definitive trend. Unfortunately, the most effective sherpa for markets these past few weeks – US monetary policy speculation – is likely to recede over the coming week. As of today (Saturday), the Federal Open Market Committee (FOMC) is in the media blackout that precedes the scheduled monetary policy meeting. Volatility often seeks justification after-the-fact, so it is still possible that the markets move first and seek explanation later. Global monetary policy will be a natural segue for macro traders already sensitive to the Fed’s efforts this past month. On the more explicit side, we have the Bank of Japan (BOJ) and Turkey central bank rate decisions. Surprisingly, speculation around the former has swung to a very unusual hawkish view; while the aggressive cut regime in Turkey is seen as taking a break. I would not rely on either of those forecasts. In the less explicit category, inflation updates from the UK and Canada will stir speculation around two of the US central bank’s principal competitors for the hawkish top spot. Alternatively, there are sentiment surveys, Chinese 4Q GDP and more in the week ahead.
Major Macro Economic Event Risk for the Next Week
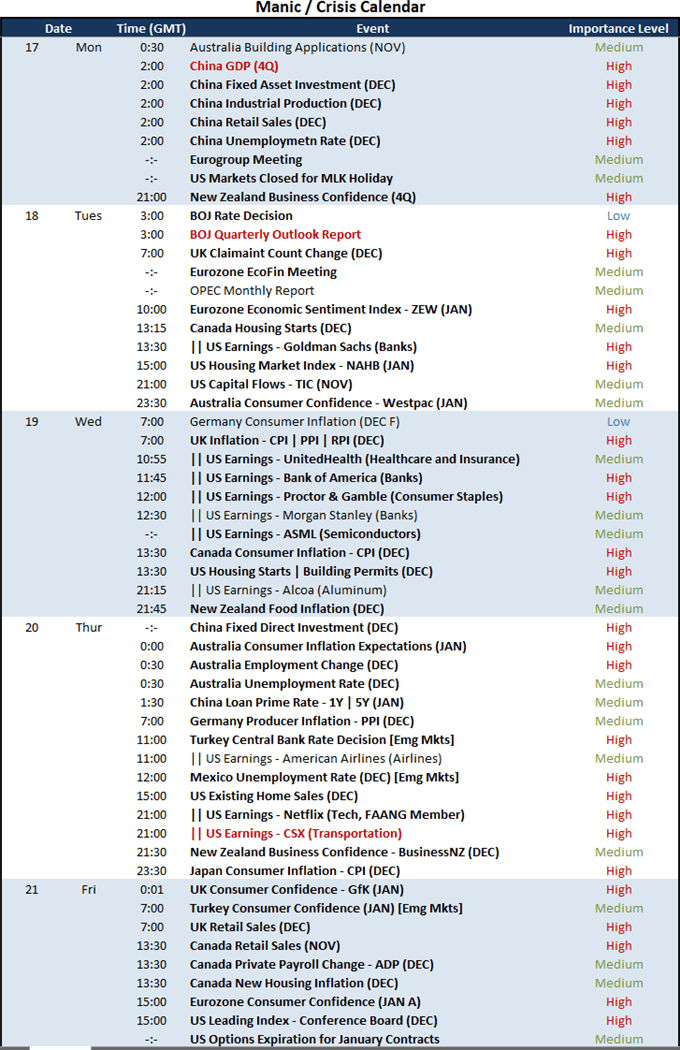
Table Made by John Kicklighter
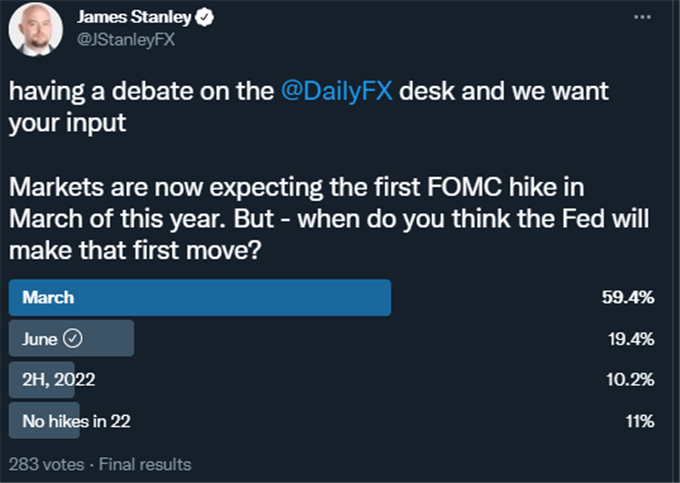
While the event risk and headlines may temporarily shift away from the anticipation around monetary policy, the matter will remain firmly planted in the back of investors’ and traders’ minds. There is well-founded speculation that the US policy authority will announce in the week after next that it intends to accelerate its tightening regime. Beyond the survey results from my colleague James Stanley (Below), we find in the CME Fed Watch tool an approximate 87 percent probability of a March 16th rate hike. If that is the path we are one, expect to see a warning issued at the January 26th meeting. It is possible that headlines stir this pot over the coming week, but there will be a strong sense of wait-and-see with critical event risk over the horizon. Remain vigilant and skeptical.
Poll Asking When the First Fed Rate Hike Will Occur
Poll from Twitter.com, @JStanleyFX
MARKETS TO WATCH: DOLLAR (STILL); EM CURRENCIES AND EARNINGS
While gauging the course of the systemic trends is important in my top-down assessment of the markets, I also tend to seek the more practical movements that can unfold in the financial system. First the Dollar. If we are heading into a period barren of the US policy updates from central bankers, the incredible charge from shorter Treasury Yields (the 2-year hit its highest level in nearly two years) and Fed Funds futures implied yields is likely to flag. Notably, the DXY Dollar index has experienced an extreme divergence with these rate sensitive measures. In fact, the 20-day correlation between the currency and yield hit its most severe, negative reading since June 2020. Readings of this severity don’t tend to last long; and it is more often the Greenback that conforms. Outside the pull of US policy, there are a range of emerging market events and backdrop risks. On the former point, we have listings like the Turkish central bank rate decision and China 4Q GDP. For the latter, outlier (‘grey swan’) risk has matters such as a possible Russian invasion of Ukraine warned by the White House and US national security apparatus.
Chart of DXY Dollar Index with 100-Day SMA and 2-Year Yield with 20 and 60 Day Correl (Daily)
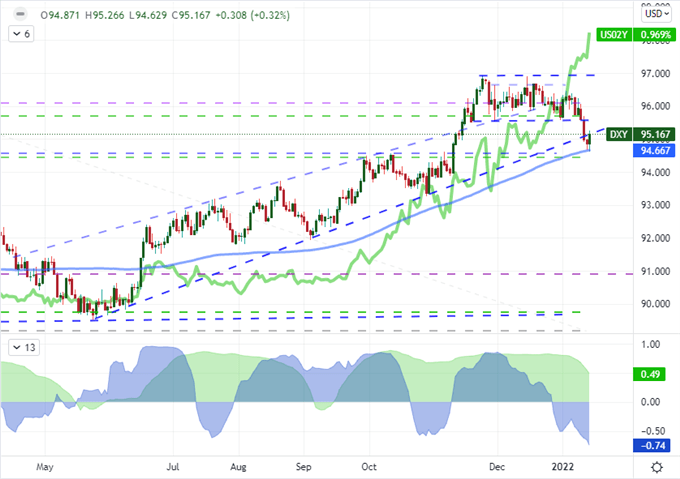
Chart Created on Tradingview Platform
SETUPS TO WATCH: DOLLAR DRIFT AND THE EARNINGS SEASON
Looking for markets that are ready to respond to the predictable event risk and themes ahead, I maintain my preference for USDJPY. There are other crosses that can move given the proper fundamental mix: EURUSD reversing from 1.1500 on a liquidity check or NZDUSD making another go at its 0.6860 inverse head-and-shoulders neckline. That said, USDJPY has a few matters working in favor of the bearish course. A pullback in risk appetite that would swamp all Yen crosses lurks in the backdrop. Excluding that market force, a natural retrenchment in US rate forecasts could add to the crosses’ slide over the past week. I carry a serious anticipation of a speculative bearing for the Dollar over the coming week, but acknowledge that surprises are a surprisingly common feature of the landscape.
Chart of USDJPY with 100-Period Moving Average and Wicks (Daily)
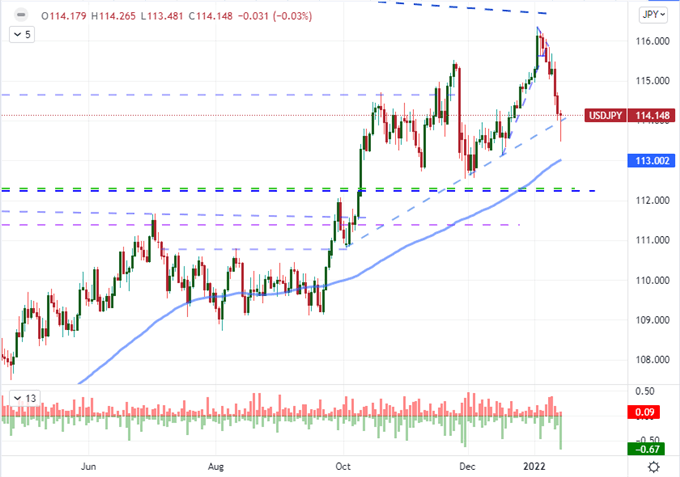
Chart Created on Tradingview Platform
From global macros to specific earnings, I will be monitoring the run of US corporate updates due over the coming week – though I may be watching the figures more for their implication for global matters. As of this past Friday, there were a run of bank earnings that speak of these institutions’ health as the interest rate regime shifts. Notably JPMorgan and BlackRock shares dropped sharply despite top line numbers that were designed to impress. Ahead, there is plenty of financial sector earnings data on tap with the likes of Goldman Sachs and Bank of America. I would like to add to the list tickers like ASML (semiconductors when China is clamping down); United Health and Proctor & Gamble for consumer health measures; CSX for supply chain concerns and NFLX as it seems to be falling from its speculative build up.
Chart 1-Year Performance of CSX, Netflix, Goldman Sachs and Other Key Tickers Due Earnings (Daily)
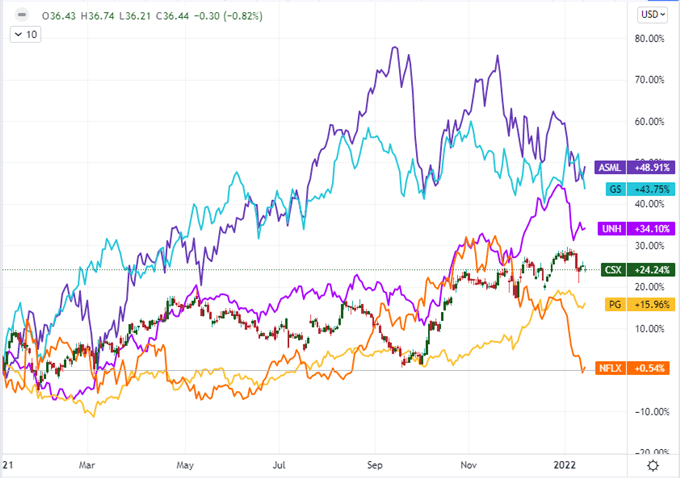
Chart Created on Tradingview Platform
Jan 17, 2022 | John Kicklighter, Chief Strategist. DailyFX


0 Comments
Recommended Comments
There are no comments to display.
Create an account or sign in to comment
You need to be a member in order to leave a comment
Create an account
Sign up for a new account in our community. It's easy!
Register a new accountSign in
Already have an account? Sign in here.
Sign In Now