6 Popular Technical Indicators for Stock Trading

Reviewed by Nick Cawley on December 23, 2021
Traders with a strong understanding of technical indicators are usually better equipped to navigate the financial markets than those that lack this knowledge. While personal investing goals, risk appetite and trading style will help to determine a strategy and trading plan, knowing what technical indicators to use in your approach can help to determine possible entry and exit points.
Hundreds of technical indicators exist, and clear signals can be identified using effective indicators as part of a strategy. This article will cover six of the most popular technical indicators for stock trading.
BEST TECHNICAL INDICATORS FOR STOCK TRADING
For traders looking for the most effective technical indicators, it is important to consider the objectives of the trading strategy as well as the current market condition. For individuals trading individual stocks, it is often beneficial to apply indicators to the stock index in which that share belongs to get a holistic view of the larger market as a whole.
Below are six of the most popular technical indicators to use when analyzing stocks:
|
INDICATOR NAME |
TYPE OF INDICATOR |
CHARACTERISTICS |
|
Client Sentiment |
Contrarian Indicator |
|
|
Relative Strength Index (RSI) |
Momentum Oscillator |
|
|
Stochastic |
Momentum Oscillator |
|
|
Simple Moving Average (SMA) |
Trend following indicator |
|
|
Exponential Moving Average (EMA) |
Trend following indicator |
|
|
Moving Average Convergence Divergence (MACD) |
Momentum oscillator |
|
CLIENT SENTIMENT
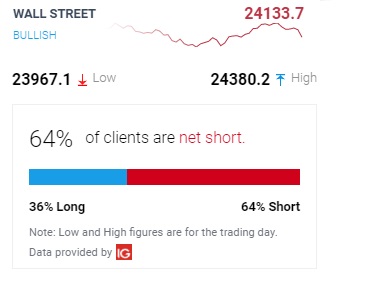
Client sentiment data is derived from a brokerage’s execution desk data, measuring live retail client trades to determine possible directional biases in the market. When sentiment is approaching extreme levels, stock traders may begin to see a reversal as more likely which is why it is seen as both a contrarian indicator as well as potentially having a leading component.
Below is an example of the IG Client Sentiment Index, IG’s sentiment gauge derived from execution desk data, for the Dow Jones index (Ticker: Wall Street). Based on the data below, 64% of traders have short positions which means that majority of traders expect the price of Wall Street to drop. However, sentiment is seen to be bullish, meaning that based on this data the price of Wall Street may be expected to increase. Although it is not advisable to trade-off sentiment (or any individual indicator) alone, an individual who is trading a constituent of the DJIA could use this data as an informative tool before applying additional indicators.
DailyFX provides client sentiment data which isderived from live IG retail client trades for forex, commodities, cryptocurrencies and major stock indices. Stock sentiment analysis is also available for individual shares on the IG platform where applicable or available.
RELATIVE STRENGTH INDEX (RSI)
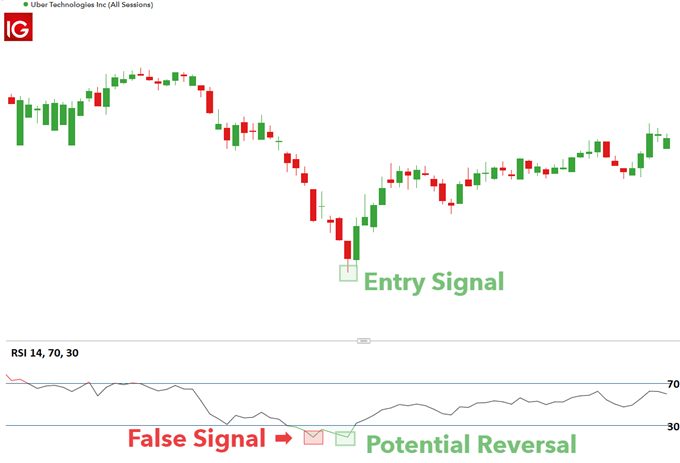
The relative strength index (RSI) is a momentum oscillator that measures the magnitude of price movements to determine whether a market is overbought or oversold. A market is seen to be oversold when the RSI is below 30 and is overbought when the RSI is above 70. These are key levels could indicate a potential reversal, classifying the RSI as a leading indicator.
The chart below shows the RSI being applied to the daily chart for Uber Technologies (Ticker: UBER). The RSI trades between 30 and 70 for some time before falling below the 30 level. Below the 30 level, the first signal is a false signal because although it looks like the trend is going to reverse to the upside, the price continues to fall. However, the second signal is present when the RSI is below 30 and turns towards the upside. However, the RSI only confirms the reversal by crossing above the 30 line the next day.
STOCHASTIC
The stochastic oscillator is another momentum indicator which is used to determine overbought and oversold conditions when trading stocks. Unlike the RSI which measures the speed of price movements, the stochastic measures current price in relation to its price range over a period of time.
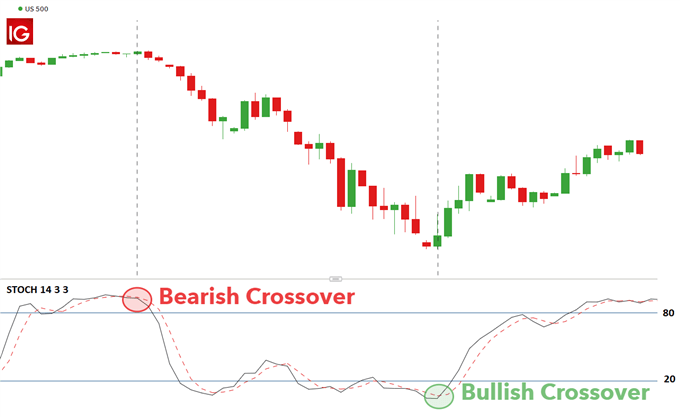
The %K line (the black line) is calculated by using the latest closing price relative to the lowest low and highest high over a specified period of time and the %D line represents the simple moving average of the %K (three period Simple Moving Average is the most common).With stochastics, a bullish crossover occurs when the %K line (the black line) crosses over and above the %D line (the red dotted line). Likewise, a bearish signal occurs when the %K line crosses under and below the %D line. The strongest signals will often occur when there is a bullish cross-coupled with a move above 20 from below and a bearish signal coupled with a move below 80.
In the image below, the stochastic indicator is applied to the S&P 500 price chart (Ticker: US 500). As indicated on the chart, a bearish crossover occurs from above the 80 line, indicating that the trend may reverse to the downside. The reversal is then confirmed once the lines cross 80. Likewise, the bullish crossover occurs below 20 and the reversal is confirmed once the 20 line is crossed.
SIMPLEMOVING AVERAGE (SMA)
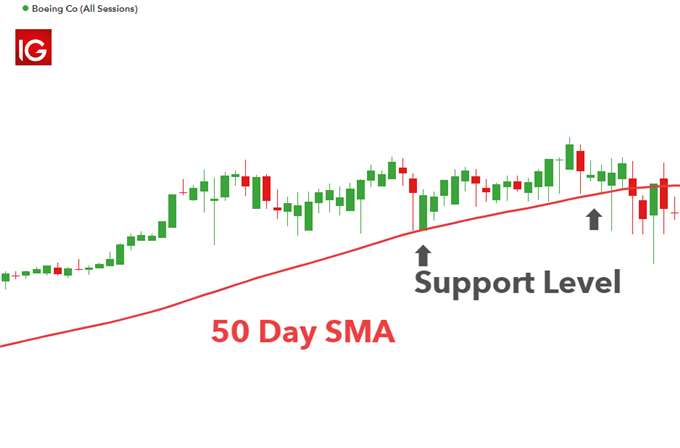
A simple moving average (SMA) is a lagging indicator which represents the average price of a security over a specified period of time. In a trending market, the moving average modulates short-term price fluctuations and allows stock traders to identify the trend in a simplistic way.
As depicted in the chart below, in a rangebound market, it is also possible to use a moving average to identify support and resistance levels. By applying the 50 day MA to the Boeing price chart, it is clear that the 50-day SMA can also be seen as potential support even as Boeing is trading in a ranging environment.
EXPONENTIAL MOVING AVERAGE (EMA)
As with the SMA discussed above, the exponential moving average (EMA) is a lagging indicator which represents the average price of a security over a specified period of time. However, unlike the SMA which gives equal weighting to all data points in the series, the EMA gives more weight to recent prices, removing some of the lag found with a traditional SMA. This makes the EMA an optimal candidate for trend trading as it allows traders to get a holistic view of the market without missing out on opportunities with may be due to the lag of a simple moving average.
MACD
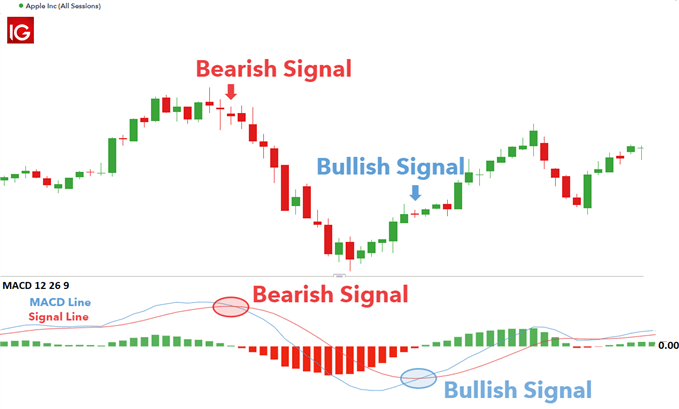
The MACD (moving average convergence/divergence) is a technical indicator that can be used to measure both momentum and the strength of the trend. The MACD displays a MACD line (blue), signal line (red) and a histogram (green) which shows the difference between the MACD line and the signal line.
The MACD line is the difference between two exponential moving averages (the 12 and 26 period moving averages using common default settings), whilst the signal line is generally a 9-period exponentially average of the MACD line. These lines waver in and around the zero line, giving the MACD the characteristics of an oscillator with overbought and oversold signals occurring above and below the zero-line respectively.
With reference to the chart below, featuring Apple, Inc. (Ticker: AAPL):
- A bullish signal is present when the MACD line crosses ABOVE the signal line from BELOW the zero line.
- A bearish signal is present when the MACD line crosses BELOW the signal line from ABOVE the zero line.
TECHNICAL INDICATORS FAQ’S
What is the difference between a leading and a lagging indicator?
Although leading and lagging indicators are both derived from historic price data, a leading indicator is used to indicate expected price movements in the market while lagging indicators are used to provide entry and exit signals once the trend has been identified.
Although similarities and differences exist between the two, both are equally important and it is often beneficial for traders to use both leading and lagging indicators simultaneously.
FURTHER READING ON STOCK TRADING
- Learn how to apply stock market sentiment analysis
- Explore the differences between stock trading and investing
- Bookmark our guide to stock market trading hours
Dec 29, 2021 | Tammy Da Costa, Analyst. DailyFX




.jpg.27c55ea07d5a17683fbdbda06b8fcace.jpg)
0 Comments
Recommended Comments
There are no comments to display.
Create an account or sign in to comment
You need to be a member in order to leave a comment
Create an account
Sign up for a new account in our community. It's easy!
Register a new accountSign in
Already have an account? Sign in here.
Sign In Now