What is the Dow?

Entry posted by MongiIG in Analyst piece
1,832 views

What is the Dow?
Jan 19, 2022
By:James Blakeway, tastytrade.
The Dow, known formally as the Dow Jones Industrial Average, is made up of 30 large U.S.-listed companies and is an indicator of how these companies have traded during a standard trading session.
“Dow Jones Hits 30,000”, or whichever milestone the index is finally reaching, is an extremely common headline in mainstream financial and general news media. The index is known around the world as the barometer for the U.S. market and, often mistakably, the U.S. economy.
Tracing its origins back to the 1890s, the Dow Jones Industrial Average is inarguably a key component of American financial and market history, but perhaps that’s where it should live, as a part of history.
The original 12 Dow companies certainly feel like relics and fittingly emblematic of the era. Components included the likes of American Tobacco, American Cotton Oil, Chicago Gas, and a more familiar name, General Electric. By the 1920’s the index had expanded to become the familiar 30 stock benchmark we know today, albeit still with vastly different components.
Dow Jones 2022 Stocks
In 2022, the 30 stocks represent most of the recognized equity sectors in the U.S., with the absence of Utilities and Real Estate. Compared to the other three main U.S. stock indices, the Dow clearly has an extremely small portfolio.
How The Dow Jones Industrial Average is Priced
The S&P 500, Nasdaq-100, and Russell 2000, all introduced after 1950, rely on market capitalization weighting, compared to the Dow’s price weighting. This means that stocks in the other three indices are given a weighting assigned by the total size of the company, not simply the stock price.
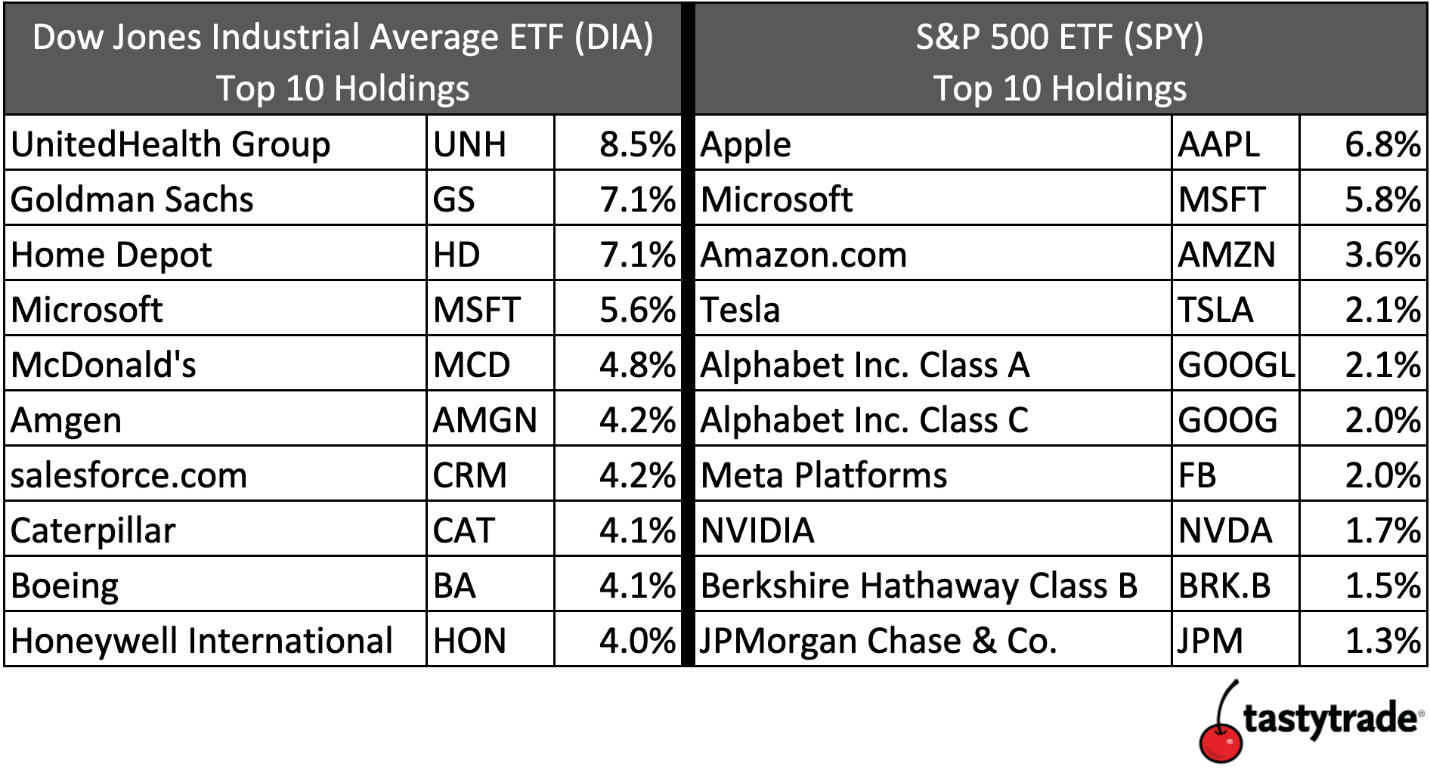
The Dow’s archaic pricing convention means that United Healthcare (UNH), a $470 stock, now makes up 8.5% of the index in the number one slot. At $440 Billion, UNH is by no measure a small company. However, UNH makes up 3% more of the index than Microsoft (MSFT), a $2.3 Trillion firm and the fourth largest component of the Dow. UNH is the 14th largest component of the S&P 500, while MSFT is the second.
Dow vs S&P 500 Performance
So, we know that the Dow prices its components counter to the other stock indices but how did this impact performance and tracking of the overall market, compared to the S&P 500?
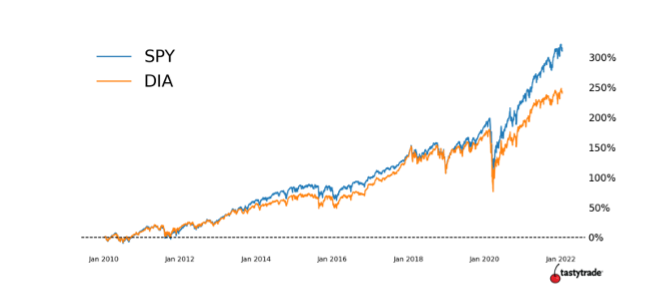
Looking at both performance and correlations, the Dow mostly, and rather impressively, mirrored the S&P 500 over the last decade. There is some clear divergence after the pandemic slump, likely driven by the relentless surge of tech stocks that constitute a larger percentage of the S&P than the Dow.
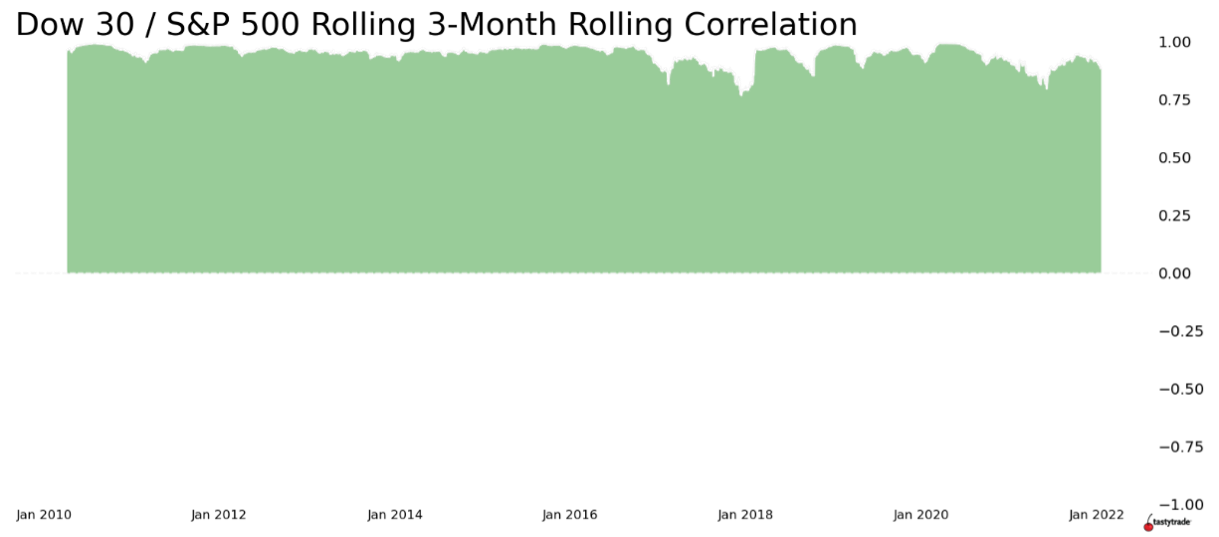
Outside of a performance lag in recent years, investors may believe that Dow tracking products still hold a place in their overall long-term holdings. This may be true and it’s and likely the Dow will continue to move like the S&P in years to come, given the concentration of large and mega-cap stocks in both indices.
Is the Dow Jones Index Tradable?
But what about active traders? Should they be scalping Dow futures or selling Dow exchange traded fund (ETF) option premium instead of the other three indices? If such traders value liquidity, then in short, no. The futures and ETF products that provide access to the Dow fall woefully short compared to the other three indices. Consider the table below analyzing both daily average for ETF share volume in 2021 and average futures volume for the December 2021 index contracts.
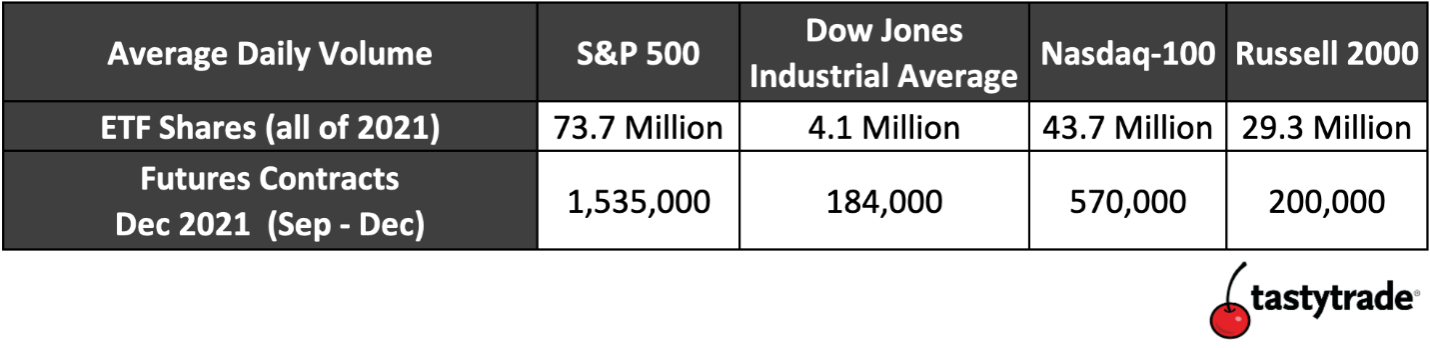
The Dow Jones ETF (DIA) did only 10% of the volume of the Nasdaq-100 ETF (QQQ), on average. Even the Russell 2000 ETF (IWM) did 7 times the volume of DIA. While the volume for the Dow futures (/YM) is not as pitiful compared to the Russell futures (/RTY), it’s still bottom of the pack.
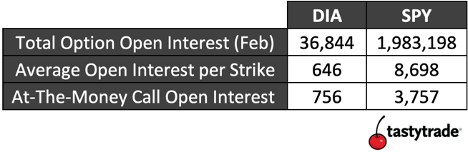
The options markets for DIA also pale in comparison to SPY, the S&P 500 ETF. Accounting for the number of available strikes, the average contracts in open interest for DIA are extremely low. Even the at-the-money call had less than 1000 contracts at the time of writing.
While we may not explain it often on our shows, these numbers tell the tale of why tastytrade rarely focuses on the Dow index or products that track it. As investors and traders in the American financial markets, the Dow Jones Industrial Average must always hold a place in our hearts and memories, just perhaps not our portfolios.


0 Comments
Recommended Comments
There are no comments to display.
Create an account or sign in to comment
You need to be a member in order to leave a comment
Create an account
Sign up for a new account in our community. It's easy!
Register a new accountSign in
Already have an account? Sign in here.
Sign In Now