Tesla’s share price stabilises after better-than-expected earnings

Entry posted by MongiIG in Market News
358 views
Despite beating analysts’ earnings and revenue expectations, Tesla was caught in last week’s strong global risk-off maelstrom but managed to bounce off support.
 Source: Bloomberg
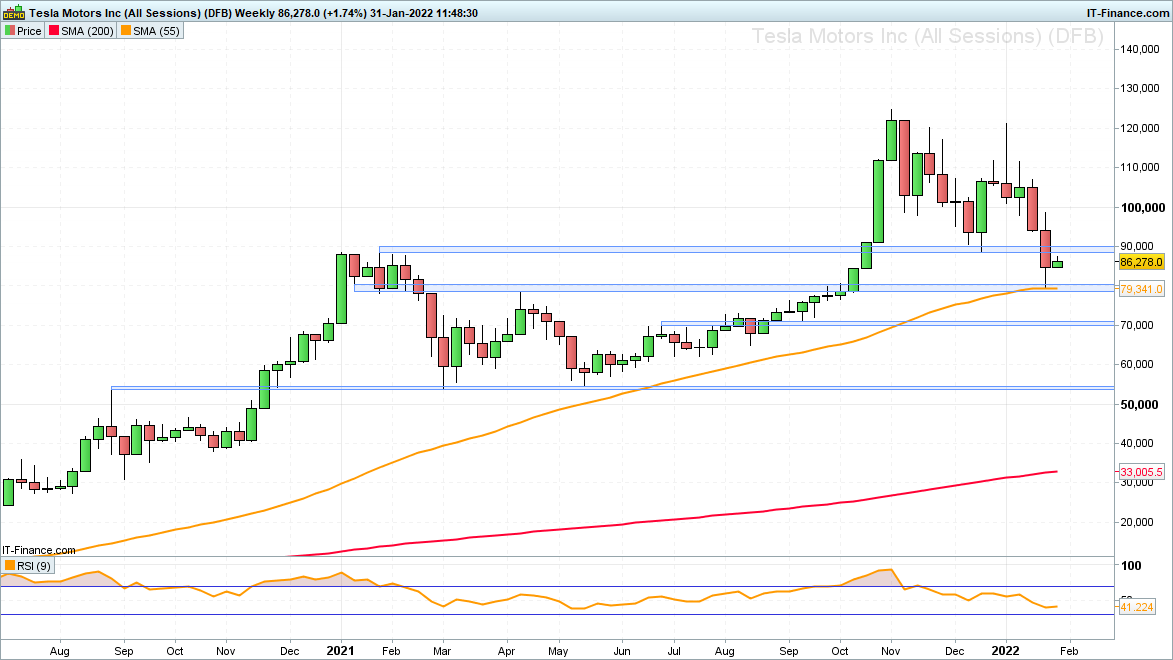
Last week Tesla (TSLA) dropped to a three-month low at $792.73, despite reporting fourth quarter (Q4) full-year 2021 earnings results that beat analysts' expectations.
The share price did, however, stabilise around the 55-week simple moving average (SMA) at $793.41, seen within its $813.95 to $780.61 support area. It is made up of the mid- and late January 2021 lows and the April and early October 2021 highs as well as the 200-day SMA.
 Source: ProRealTime
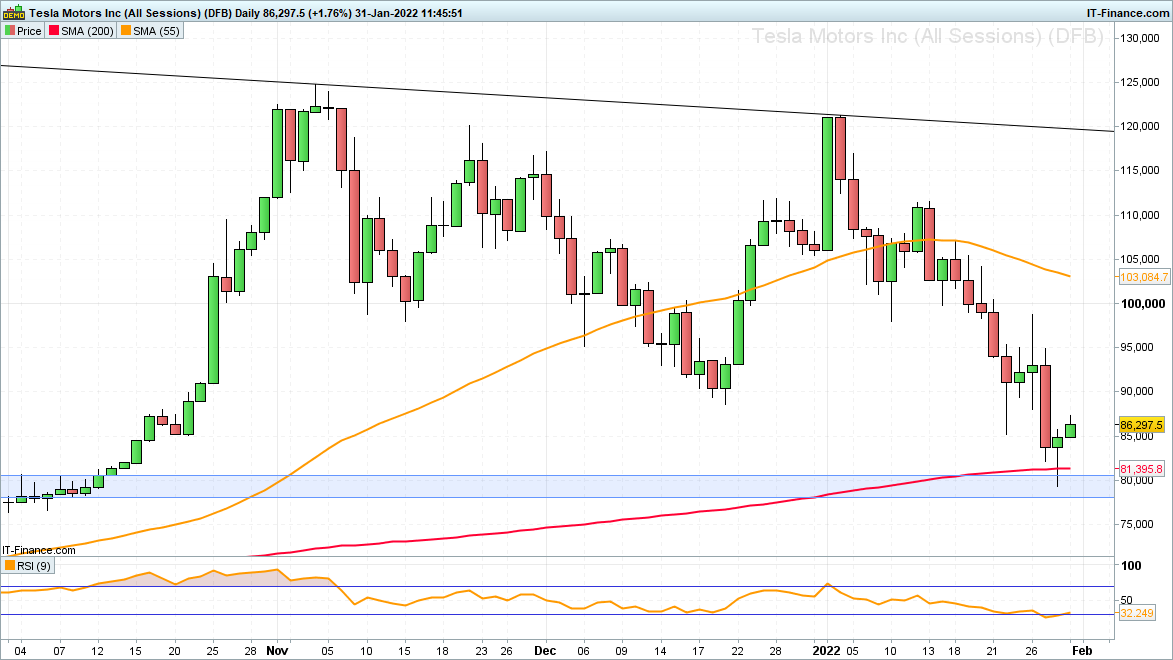
Friday’s bullish ‘Hammer’ formation on the daily candlestick chart should be confirmed by a US close made today above Friday’s high at $857.27.
The pattern is formed when a new low has been formed on a candlestick chart which is then followed by a close made near the candle’s open and where the length of the ‘shadow’ below the candle’s ‘body’ is at least three times as long as that of the ‘body’.
The ‘body’ is the coloured box which shows the difference between the opening and closing price - green if bullish and red if bearish - and the ‘shadows’ are the vertical lines drawn above and below the ‘body, which denote the high and low of a candle.
 Source: ProRealTime
The ‘Hammer’ is a bullish reversal pattern because it ‘hammers out’ a bottom since the buyers manage to heave the candle close back towards its open, despite new lows having been made.
It marks a shift in market psychology and points to a potential trend reversal from bearish to bullish if a rise above the ‘Hammer’s' candlestick high point is seen on the following candle.
Fundamentally Tesla was not only the best-selling electric vehicle brand in Europe in 2021, but it also aims to achieve 50% average annual growth in vehicle deliveries over a multi-year horizon. This should be positive for its share price, despite ongoing challenges in global supply chains limiting its ability to run its factories at full capacity.
Following on from January’s 30% drop in the Tesla share price from this year’s high-to-date at $1212, a recovery is expected to unfold, now that technical support levels have held. The December trough at $886.25 represents the first upside target.
After the descent from last week’s high at $987.13, the buyers will need to drive the price back above this level to reverse some of the recent bearish view. This high was made within the $979 to $1000 resistance area which comprises the November and early January lows as well as psychological resistance. As such it may prove difficult to overcome.
Were last week’s low to give way in the course of this or next week, however, the August high and September low at $709.53 to $699.95 would be targeted.


.jpg.27c55ea07d5a17683fbdbda06b8fcace.jpg)
.png.02f0e5e742ffe3a81b011c17df3009ee.png)


0 Comments
Recommended Comments
There are no comments to display.
Create an account or sign in to comment
You need to be a member in order to leave a comment
Create an account
Sign up for a new account in our community. It's easy!
Register a new accountSign in
Already have an account? Sign in here.
Sign In Now