Lloyds looking technically fragile while below £55.96
A potential drop out of the recent uptrend channel could trigger another swift sell-off.
 Source: Bloomberg
Lloyds Banking Group began the new year on a strong footing, rising by nearly 15% to £55.96 on the back of UK inflation soaring to a 30-year high in December.
The share price then gave back most of these gains by late January, painting a slightly less rosy picture.
Last week the Bank of England (BoE) imposed back-to-back interest rate hikes for the first time since 2004 and began the process of quantitative tightening with the Lloyds share price oscillating around the £52 mark, still up around 5% year-to-date. \
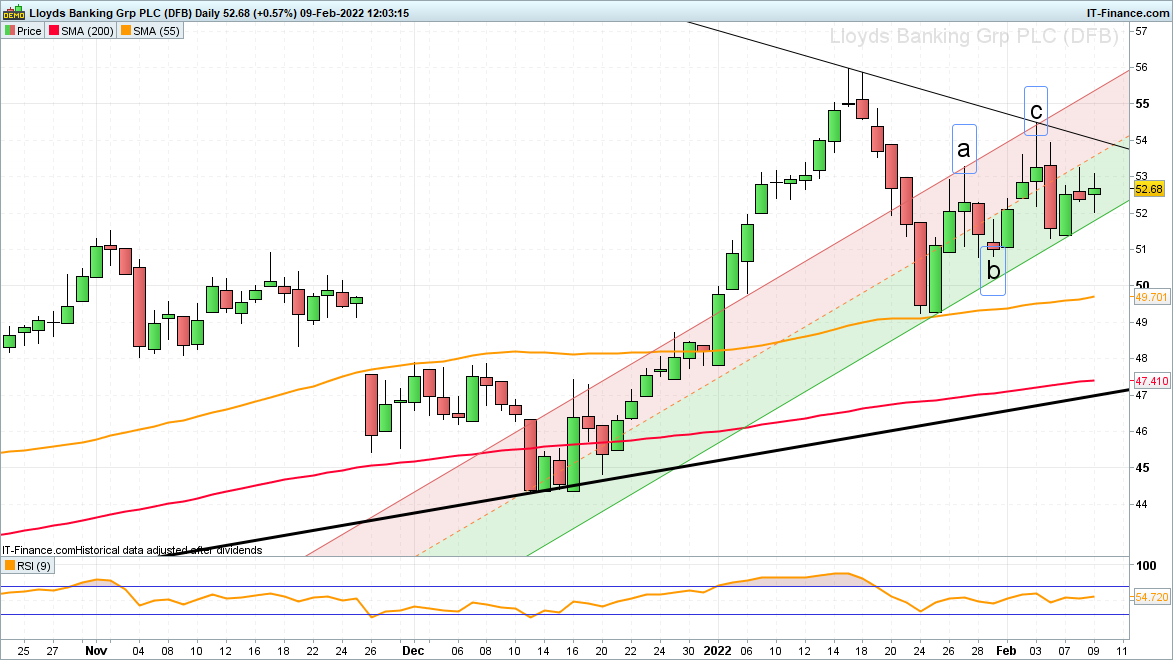
From a technical perspective the fact that the decline in the share price from its £55.96 January high has been fast, a drop of over £5 in just as many days, is deemed to be impulsive. This is to say that the sellers have dominated and thus created a short-term downtrend.
The upward move from the late January low at £49.25 has taken twice as long and looks corrective, however, meaning that another down leg may be around the corner.
 Source: ProRealTime
In Elliott wave terms the last couple of weeks’ gradual advance may be described as an ‘a-b-c’ zig-zag correction. This is usually followed by another impulse move, in case of the Lloyds' share price, to the downside.
Therefore, once the stock has left its two-week uptrend channel, a bear flag will have been formed with the 200-day simple moving average (SMA) and the 2020 to 2022 uptrend line at £47.41 to £47.02 representing possible downside targets.
The trigger for the bear flag formation would be a daily chart close below the last reaction low, namely the 4 February low at £51.30. Once the slightly lower late January low at £50.82 has been slipped through as well, the May 2021 high, 55-day SMA and January trough at £49.74 to £49.25 will be in focus, ahead of the next lower £47.041 to £47.02 target area.
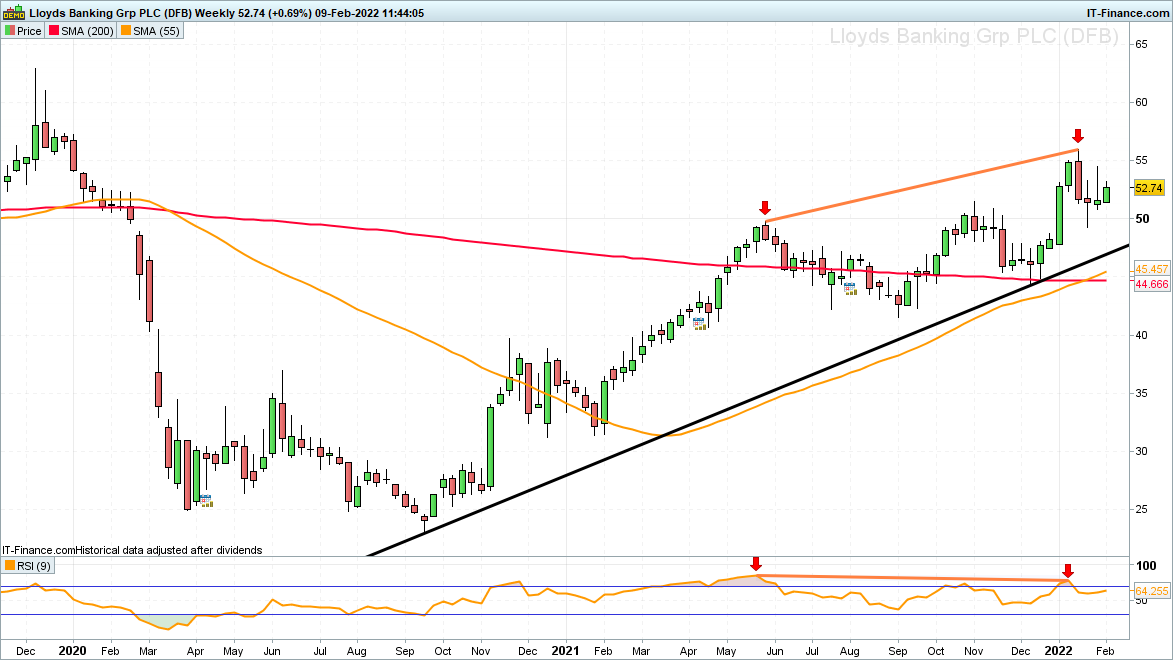
While the latter underpins, the long-term 2020 to 2022 uptrend remains valid, however. This is because of a series of higher highs and higher lows being visible on the weekly chart, i.e. the definition of an uptrend.
 Source: ProRealTime
So why have a short-term bearish outlook if the longer-term trend is clearly still bullish? The technical reason is threefold:
- a ‘Bearish Engulfing’ pattern was formed on the weekly candlestick chart, the very week in January when this year’s high-to-date was made (i.e. a new high was achieved, yet the weekly close occurred below the previous week’s low, thus encompassing and thereby negating all of the previous week’s bullish momentum)
- last week formed an ‘Inverted Hammer’ where the share price tried to revisit the January high but failed to do so and instead closed the week only marginally above its open. If last week’s low at £50.82 were to be slipped through, the pattern would be triggered and viewed as bearish
- the January peak has been accompanied by negative divergence on the daily Relative Strength Index (RSI) which often leads to consolidation and sometimes to a change in trend direction.
As stated above, only a drop through last week’s £50.82 low would confirm that the technical picture has indeed turned bearish. Until this happens, the current February high at £54.50 may still be exceeded, in which case all bearish bets are off. This is because in this scenario the odds would shift back in favour of the bulls with the recent high at £55.96 and the £58-to-£63 region being eyed instead. This capped the share price since 2016.


1 Comment
Recommended Comments
Create an account or sign in to comment
You need to be a member in order to leave a comment
Create an account
Sign up for a new account in our community. It's easy!
Register a new accountSign in
Already have an account? Sign in here.
Sign In Now