Australian earnings this week: the top stocks to watch

Entry posted by ArvinIG in Analyst article
674 views
Australian earnings this week: the top stocks to watch
We look at three of the big companies reporting to begin the week on the ASX, as the reporting period enters its second week.
Source: Bloomberg
BHP Group (BHP) – 15th of February
What are the markets expecting from BHP?
The market is expecting a drop in profits year-over-year from BHP to 9.8 billion, but an improved performance in the last half, thanks to the rebound seen in iron ore prices over the past 6 months. The outlook has improved for the stock of late, as hopes rise of recovering Chinese economy, that’s seen iron ore exceed $US150.00 per tonne in recent weeks. However, there remains scepticism how much further prices have to run, as China looks to boost growth this year after a 2021 marred by a slow down in its property market. Currently, analyst rate BHP shares a “hold”, with 11 designating that rating, and 7 recommending a buy and 3 sell. Consensus price target reflects the neutral sentiment towards the company, which is currently around $46.22.
Technical analysis of BHP shares
In the short-term, the technicals look relatively healthy for BHP shares. Momentum is skewed to the upside with the weekly RSI trending higher and nearing the 70-level, with price above the 20, 50, 100 and 200 DMAs. There’s likely to be some technical resistance for the stock around the psychologically significant $50.00 mark, with resistance above that around $51.00. On the downside, support might be found at just below $46.00, and the 20-week MA at $44.70.
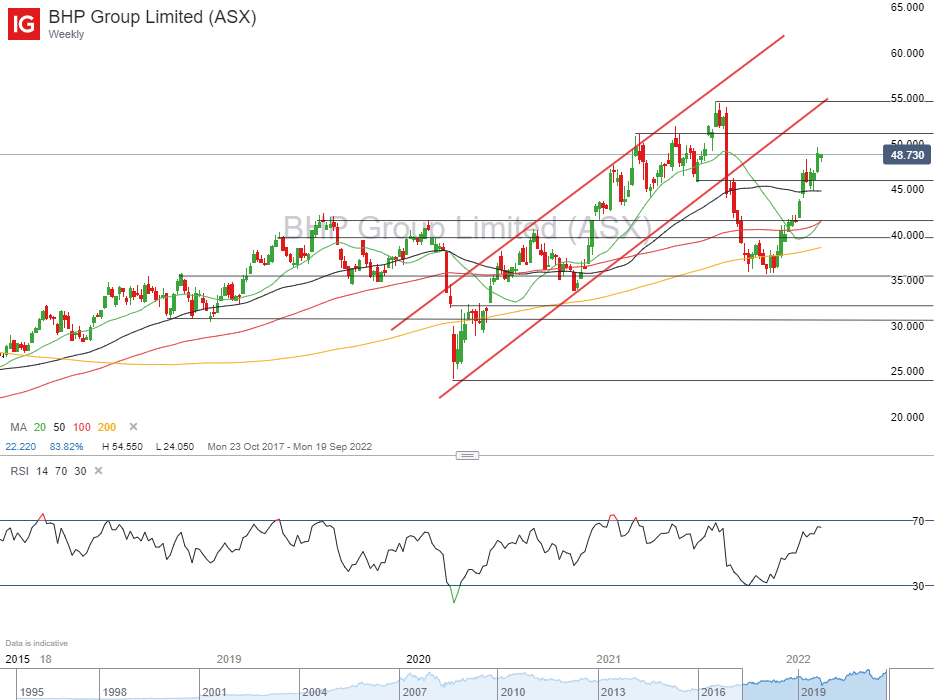
Source: IG
Fortescue Metals Group (FMG) – 16th of February
What are the markets expecting from FMG?
Analysts see FMG shares as deeply overvalued, with the consensus price target materially below current prices and at $16.70. As a result, the company has a consensus sell rating amongst 19 brokers, with 10 recommending that action, 8 suggesting to hold, and only 1 ascribing a buy. Profits over the year are tipped to have fallen considerably over the past 12-months, but have rebounded in the last half courtesy of the China fuelled rise in iron ore prices. Currently, Net Profit After Tax is forecast to be $US2.8B for half-year 2022, with the dividend expected to be paid $US0.67.
Technical analysis of FMG shares
The charts still look constructive for FMG, with the primary trend skewed to the upside despite last year’s trend reversal and price action. Long-run momentum remains skewed to the upside, with price back above all key weekly moving averages. With brokers relatively bearish on the stocks, upside may be curbed for FMG, although the key driver will be iron ore prices, especially as Chinese authorities attempt to simultaneously boost growth and control rising costs. Key support for FMG shares is around $21.40 right now. The double top at $26.40 is the most noteworthy level of technical resistance.
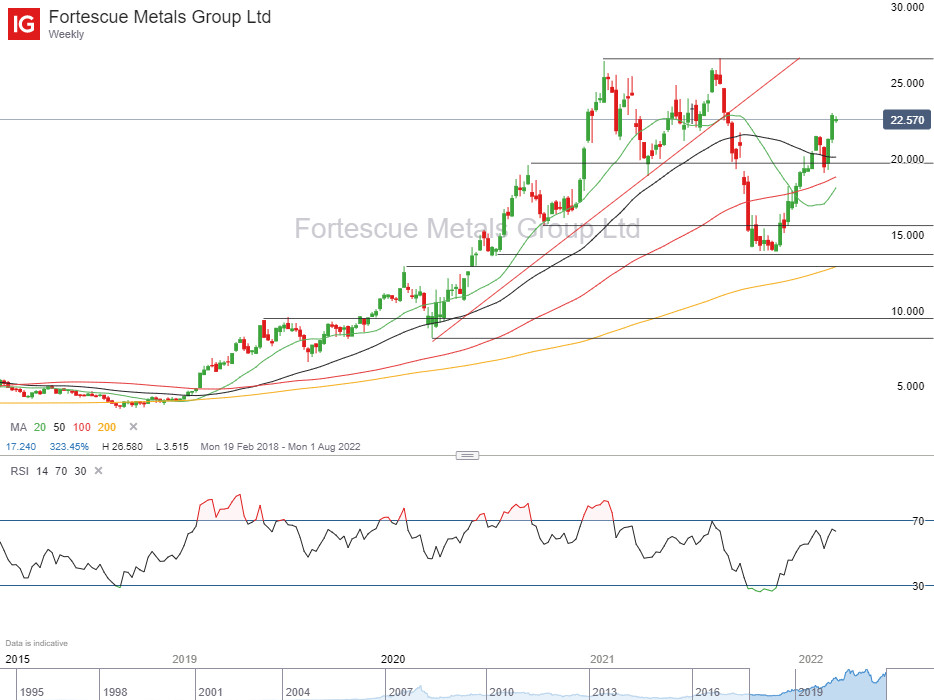
Source: IG
CSL Ltd (CSL) – 16th of February
What are the markets expecting from CSL?
CSL is a company that has largely suffered from the impacts of the pandemic, with it struggling to grow sales and protect margins amidst the difficulty to collect plasma effectively and cheaply. Growth over the past 12 months is expected to have contracted for the company as a result, with estimates of $US1.46B is net profit and $US1.13 dividend reflecting this fact. The outlook is expected to improve over time for CSL though, with brokers remaining broadly bullish on the stock. At present, it has a consensus buy rating out of 15 analysts, with 10 recommending a buy, 5 a hold, and none recommending to sell. Consensus price target is $320.15.
Technical analysis of CSL shares
Given the analyst community’s optimism about CSL’s value, it might be argued the company is a buy-the-dip opportunity, despite what are fairly ugly technicals. The share price is in a primary down trend, with it nearing technically oversold levels on the weekly RSI. Crucially, it’s also nearing a significant level of technical support around $240.00 per share, which if broken, might open a drop in the short-term towards $230.00. If the dip buyers do sweep in however, the first key level of resistance is someway from the current price, at just above $267.00.
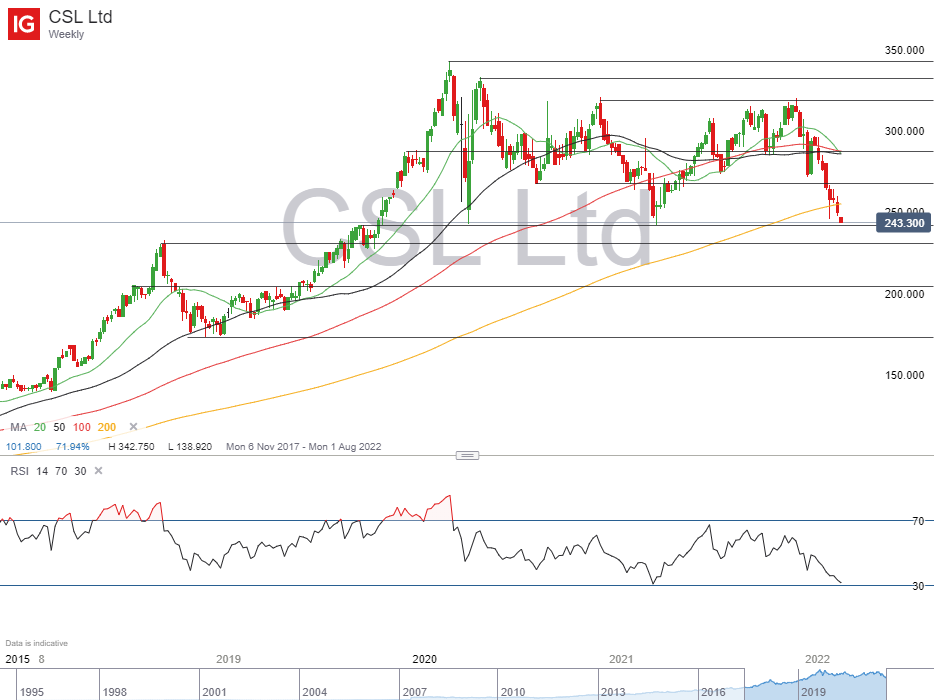
Source: IG
Take your position on over 13,000 local and international shares via CFDs or share trading – and trade it all seamlessly from the one account. Learn more about share CFDs or shares trading with us, or open an account to get started today.
Kyle Rodda | Market Analyst, Australia
14 February 2022


.jpeg.98f0cfe51803b4af23bc6b06b29ba6ff.jpeg)
.jpeg.573e1479f76cb6c02faab8d9bd670ff8.jpeg)

0 Comments
Recommended Comments
There are no comments to display.
Create an account or sign in to comment
You need to be a member in order to leave a comment
Create an account
Sign up for a new account in our community. It's easy!
Register a new accountSign in
Already have an account? Sign in here.
Sign In Now