Jump to content

Gold tips $1900 and silver jumps 8% as investors seek safe havens


MongiIG

553 views

The escalating tension in Eastern Europe has caught the whole world’s attention and reinforced the precious metals’ investment appeal amid the rising appetite for safe haven shelter.

BG_silver_gold_9844445.jpgSource: Bloomberg
Hebe Chen | Market Analyst, Australia | Publication date: Friday 18 February 2022 

Gold heading towards 12-month-high

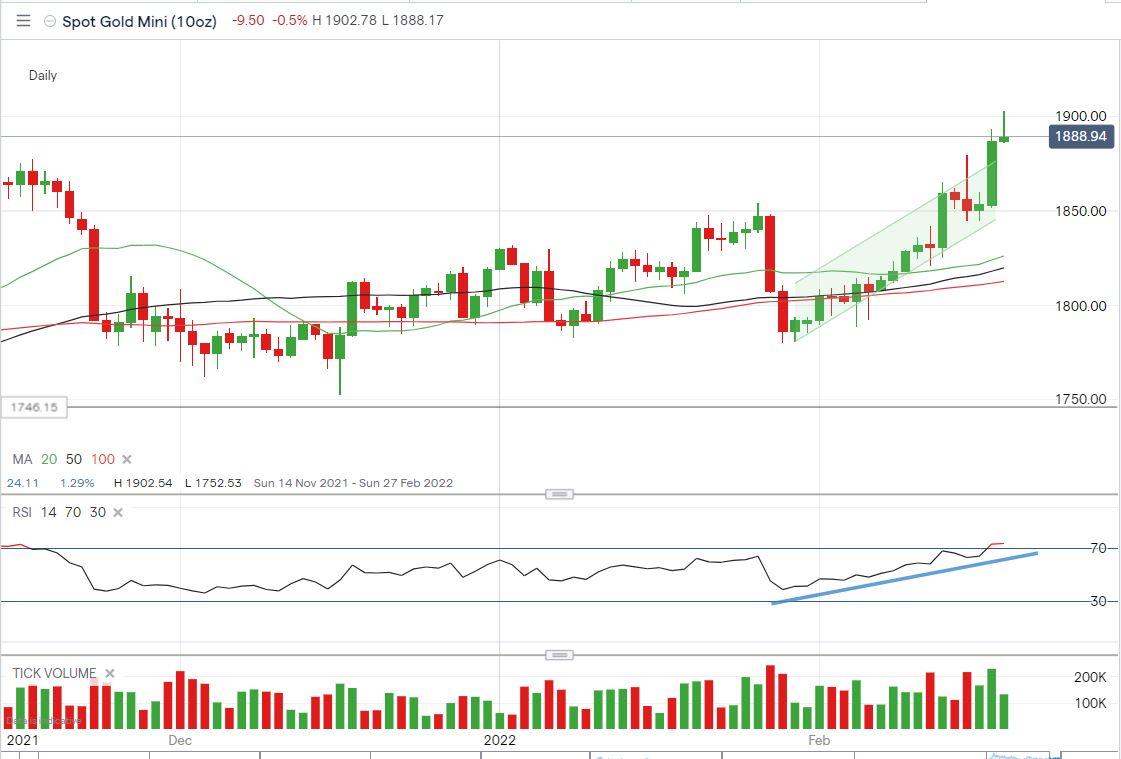
Gold prices are sharply higher this week. A fresh eight-month high just above $1,900.00 was recorded on Thursday. The cost of the yellow metal has been up 7% for the past three weeks. The upward pathway is likely to continue as the current trendline is poised to be replaced with another steeper one.

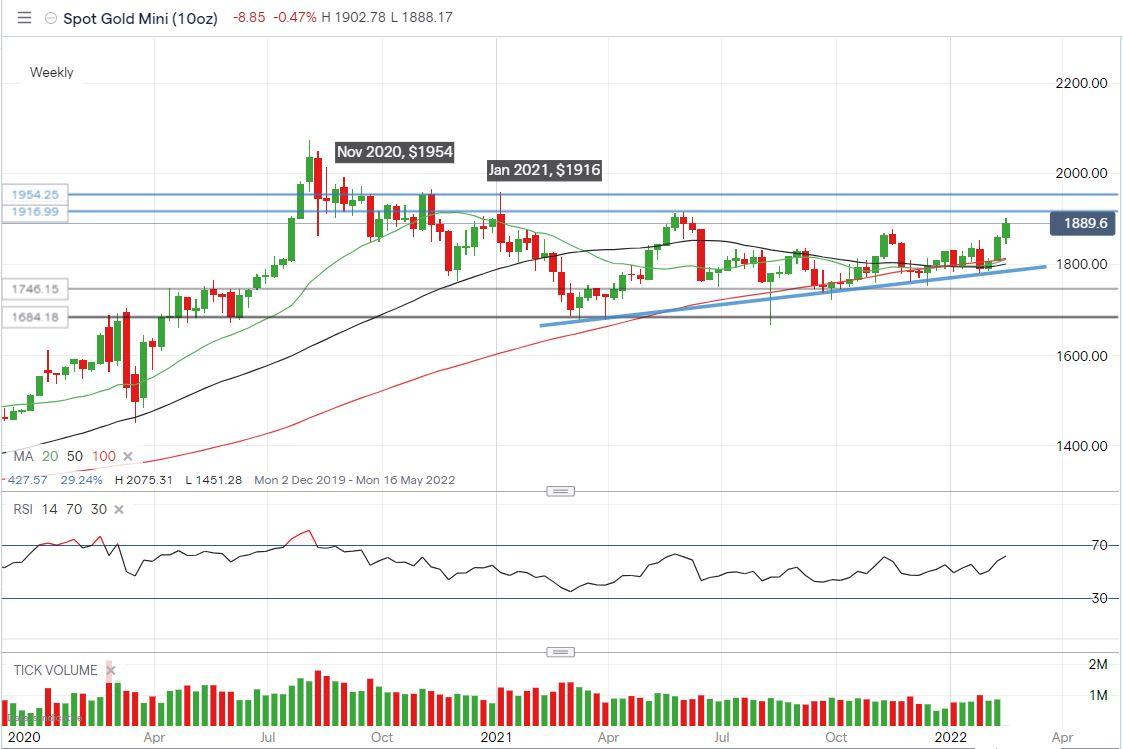
From a bigger picture we can see that the trendline connected by the lows from March 2021 has shown strong momentum underpinning the price growth of the precious metal, which is now just a step away from the 12-month-high at $1916.

The next challenge to face after $1916 can be found three months prior at $1954, which was reached on November 9th, 2020. The nearest support in view is $1870, the top point in November 2021, before the price pulls back to this January's high at $1847.

Gold%20daily1802.JPGSource: ProRealTime
Gold%20weeky.JPGSource: ProRealTime

Silver: RSI shows momentum to move higher

Safe haven demand is the prominent reason behind rising commodity prices as more and more people believe a Russian invasion of Ukraine is "imminent." As such, the silver price mirrors the strong pace of the gold price, having advanced 8% higher in February up to this week.

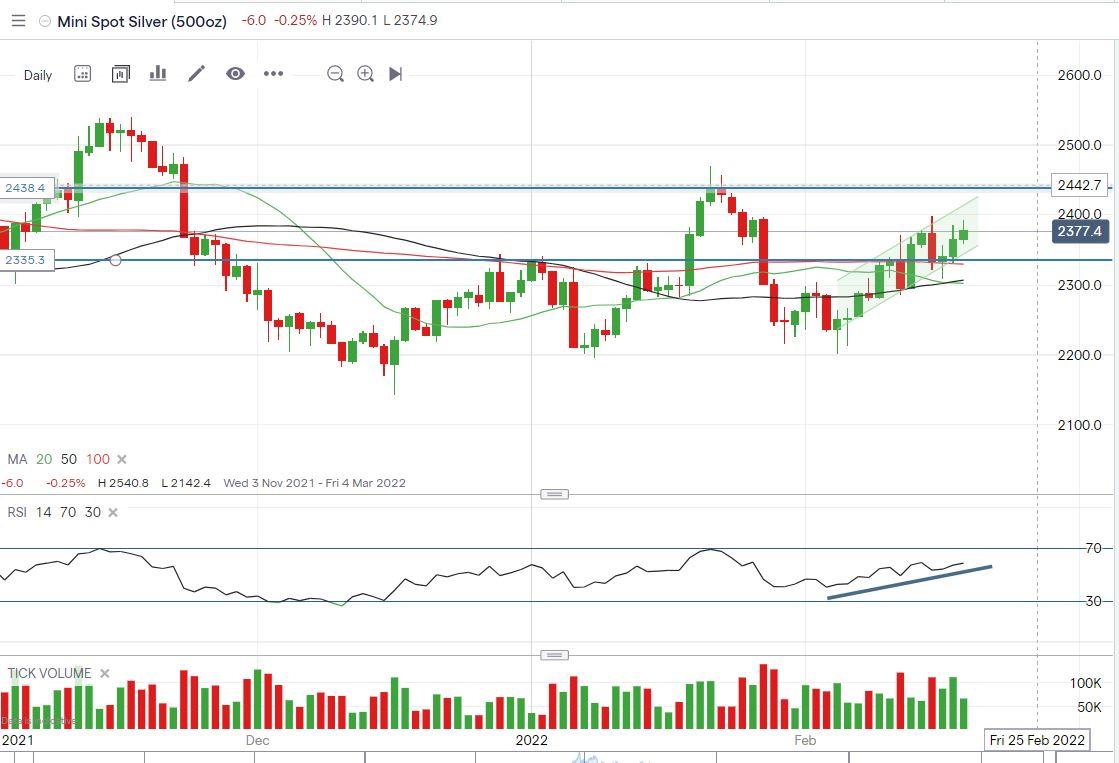
On the daily chart, the silver price is clearly trading in a 'rising tunnel' that is expected to send the price towards $24 in the near-term and challenge the January high at $2442. Although it looks like the price has encountered some pressure at the level of $23.77, the buyers' momentum shown from the RSI is pointed to push the price higher.

For those bull buyers looking to participate at the dip, a mild retreat to the lower boundary of the moving channel around $23.50 could be considered as a buying opportunity. At the same time, the level below $23.00 should be an early sign for the momentum to overturn.

Silver%20daily.JPGSource: ProRealTime

0 Comments


Recommended Comments

There are no comments to display.

Create an account or sign in to comment

You need to be a member in order to leave a comment

Create an account

Sign up for a new account in our community. It's easy!

Register a new account

Sign in

Already have an account? Sign in here.

Sign In Now
  • Blog Statistics

    • Total Blogs
      3
    • Total Entries
      2,821
  • Latest Forum Topics

  • Our picks

    • Are these the best AI stocks to watch in May 2024?
      Microsoft, Apple, Nvidia, Amazon and Meta could be the best AI stocks to watch next month. These stocks are the largest AI stocks in the US based on market capitalisation.
    • Natural Gas Commodity Elliottwave Technical Analysis
      Natural Gas


      Mode - Impulsive 


      Structure - Impulse Wave 


      Position - Wave (iii) of 5


      Direction - Wave (iii) of 5 still in play


      Details:  Price now in wave iii as it attempts to breach 1.65 wave i low. Wave (iii) is still expected to extend lower in an impulse.


      Natural Gas is currently breaching the previous April low, marking a decisive move as the impulse initiated on 5th March continues its downward trajectory, further extending the overarching impulse wave sequence that commenced back in August 2022. This decline is anticipated to persist as long as the price remains below the critical resistance level of 2.012.


      Zooming in on the daily chart, we observe the medium-term impulse wave originating from August 2022, which is persisting in its downward trend after completing its 4th wave - delineated as primary wave 4 in blue (circled) - at 3.666 in October 2023. Presently, the 5th wave, identified as primary blue wave 5, is underway, manifesting as an impulse at the intermediate degree in red. It is envisaged that the price will breach the February 2024 low of 1.533 as wave 5 of (3) seeks culmination before an anticipated rebound in wave (4). This confluence of price movements underscores the bearish sentiment prevailing over Natural Gas in the medium term.


      Analyzing the H4 chart, we initiated the impulse wave count for wave (3) from the level of 2.012, which marks the termination point of wave 4. Notably, price action formed a 1-2-1-2 structure, with confirmation established at 1.65 and invalidation set at 2.012. The confirmation of our anticipated direction materialized as price breached the 1.65 mark, signifying a resumption of bearish momentum. Presently, there appears to be minimal resistance hindering the bears, thereby reinstating their dominance in the market. It is projected that wave iii of (iii) of 5 will manifest around 1.43, indicative of the potential for the wave 5 low to extend to 1.3 or even lower. This comprehensive analysis underscores the prevailing bearish outlook for Natural Gas in the immediate future.


      Technical Analyst : Sanmi Adeagbo
       
        • Like
    • Meta Platforms’ earnings round-up: Share price plunged despite 1Q beat
      Meta’s share price plunged as much as 16% in post-market trading, following the release of its 1Q 2024 results.
×
×
  • Create New...
us