Gold, oil, natural gas prices affected by the Russia-Ukraine crisis

Entry posted by ArvinIG in Analyst article
742 views
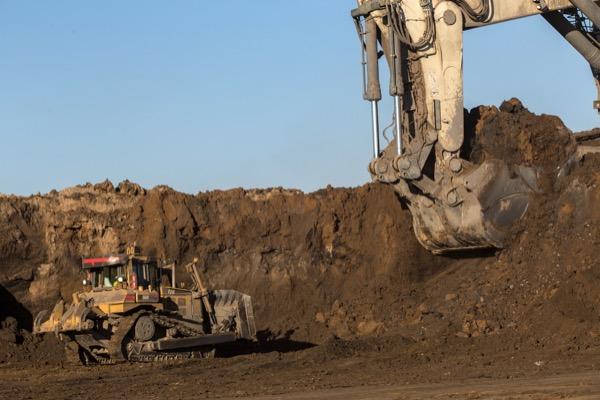
In this article we take a look at some of the key commodities (gold, oil, platinum, palladium and natural gas) affected by the current geopolitical turmoil, and how they are reacting right now.
Source: Bloomberg
Following the announcement of fresh sanctions on Russia by the West, Russian president, Vladimir Putin, has initiated an attack on the Ukraine which is seeing elevated volatility in the market.
In this article we take a look at some of the key commodities (gold, oil, platinum, palladium and natural gas) affected by the current geopolitical turmoil, and how they are reacting right now.
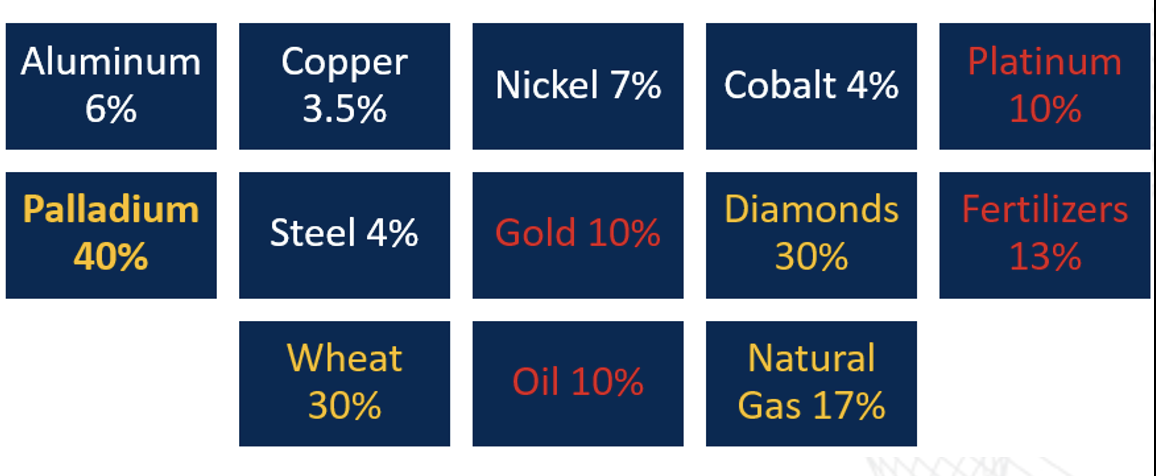
Russia’s percentage share of key global commodity production in 2021
Source: IG
The above graphic shows the percentage share of global production from Russia in 2021, as sourced from Refinitiv workspace. While we have seen base metals like aluminum and nickel rallying to new highs, Russia’s contribution to global output appears less signficant in this department when compared to diamonds, precious metals and energies.
Gold, platinum and palladium
The country is a key producer of platinum group metals (PGMs) most significantly palladium (40% of global production in 2021).
Russia is also the third largest gold producer in the world accounting for roughly 10% of global production. Gold prices are being further elevated by increased safe haven demand through the conflict.
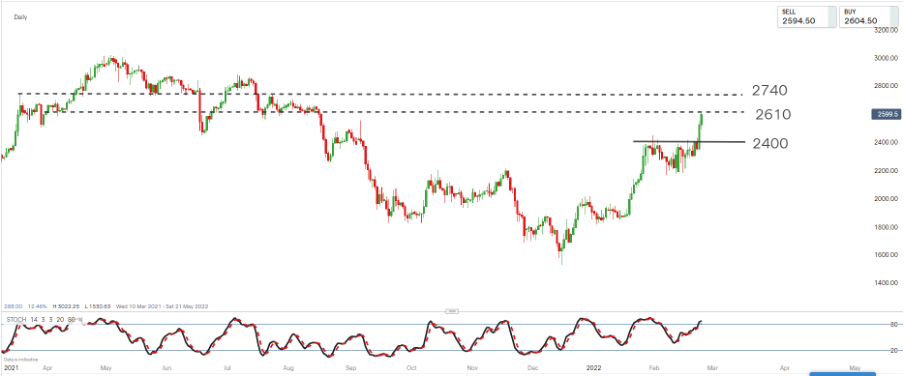
Source: ProRealTime
The price of the march contract for palladium has moved aggressively through the $2400/oz mark to test resistance at $2610/oz. A close above this level could unlock further gains with $2740 the next upside resistance target from the move.

Source: ProRealTime
Since breaking out of a bullish triangle consolidation, the price of platinum has pushed through resistance at $1075/oz and $1105/oz. Pullbacks within the new uptrend consider long entry with $1150 the next upside resistance target from the move.
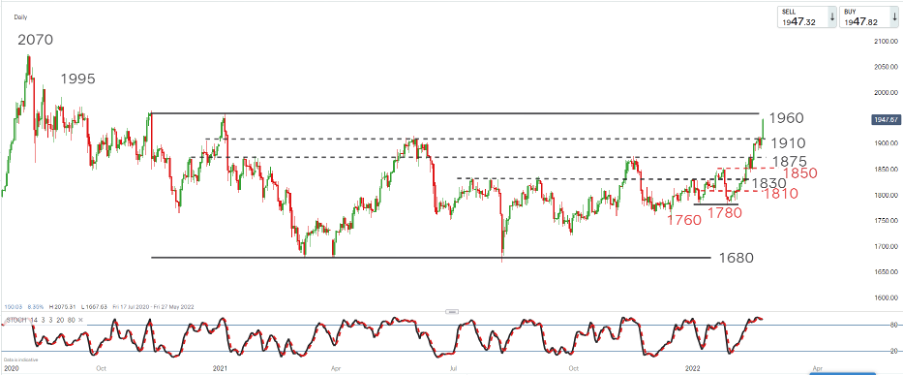
Source: ProRealTime
Safe haven appeal is seeing gold now move to test the upper resistance level ($1960/oz) of the broad range which has been in place for the last two years or so. A break above $1960/oz could see $1995 and $2070/oz as further resistance targets from the move.
Diamonds
Russia is also believed to have the largest deposits of diamonds in the world and is the largest producer of rough diamonds.
Oil and gas
In terms of energies in recent years, gas supplies have accounted for 17% of the global total and nearly a third of supply to Europe. The country is an ally of the Organisation of Petroleum Exporting Countries (OPEC) which has been keeping oil supply throttled, despite increasing demand through an economic rebound from the Covid-19 pandemic.
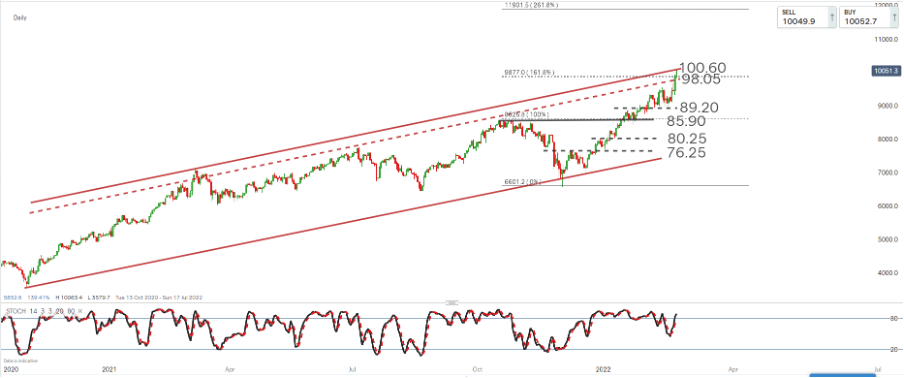
Source: ProRealTime
The long-term trend for Brent crude remains firmly up, with the short-term momentum pushing the price to our upper channel resistance target of $100.60/barrel.
Pullbacks within this uptrend are considered buyable with a longer-term upside target of $119/barrel projected from a Fibonacci extension.
Shaun Murison | Senior Market Analyst, Johannesburg
25 February 2022


.jpeg.98f0cfe51803b4af23bc6b06b29ba6ff.jpeg)
.jpeg.573e1479f76cb6c02faab8d9bd670ff8.jpeg)

0 Comments
Recommended Comments
There are no comments to display.
Create an account or sign in to comment
You need to be a member in order to leave a comment
Create an account
Sign up for a new account in our community. It's easy!
Register a new accountSign in
Already have an account? Sign in here.
Sign In Now