Nasdaq 100 rebound may inspire APAC stock, crude oil and gold retreat

Entry posted by ArvinIG in Analyst article
715 views
Wall Street stocks rebounded from deep losses Thursday as investors assessed western sanctions on Russia. Crude oil and gold prices retreated from intraday highs. APAC equities may open higher.

Source: Bloomberg
S&P 500, Hang Seng Index, ASX 200 Index Outlook
- Dow Jones, S&P 500 and Nasdaq 100 indexes closed +0.28%, +1.50% and +3.44% respectively
- Ukraine crisis escalated rapidly after Putin ordered military attack on its neighbour. But US and EU sanctions against Russia appear to have fallen short of expectations, alleviating concerns over tightening oil supply
- Asia-Pacific markets look set to open higher following a strong US lead, as investors assess geopolitical risks and rising bets on Fed rate hikes.
Ukraine crisis, gold, oil, Alibaba, Asia-Pacific at open
Wall Street equities rebounded from deep losses during late hour trade on Thursday despite an abrupt escalation in geopolitical tensions in Eastern Europe. the Nasdaq 100 index led the rebound, erasing initial losses and finishing 3.4% higher. Dip-buyers appeared to have returned looking for bargain hunting opportunities as investors assessed the latest round of Western sanctions against Russia, the severity of which seems have fallen short of expectations.
Russian President Vladimir Putin ordered a military attack on Ukraineon Thursday, a move that boosted market volatility. Putin said Russia doesn’t plan to “occupy” its neighbor, but that action was necessary after the US and its allies crossed Russia’s bottom line by expanding the NATO alliance. Russian forces are reportedly pushing closer to occupy Kyiv, Ukraine’s capital city.
President Joe Biden retaliated with stiffer penalties, including actions against five major Russian banks. The sanctions do not include barring the nation from the SWIFT payment network, which is crucial to the settlement of crude oil and other natural recourses for Russia. There is also a lack of evidence to restrict Russian oil and gas exports, which are important source of energy to the European Union. This may explain the wild swing in equities, crude oil and gold overnight, as investors shrugged off concerns about tougher punishments from the west that may add supply constraints to the energy market.
Gold prices pulled back to $1,910 from an intraday high of $1,974 – a level not seen since September 2020 – as heaven-demand ebbed during the late hours of trading. Still, heightened geopolitical risk is expected to keep the yellow metal afloat as the Ukraine situation remains highly fluid and ambiguous.
Brent Crude oil prices retreated to below the $100 mark as traders assessed the impact of Western sanctions, which left Russian oil exports largely intact. Meanwhile, the US is working with major consuming nations to coordinate releases from strategic reserves to contain rising energy prices. Rising oil prices will translate into higher inflation, which may urge the Federal Reserve and other central banks to consider more aggressive tightening approaches. The Fed is widely expected to raise interest rate by 25bps at the March FOMC meeting. With oil prices surging towards $100 bbl, the likelihood of an earlier hike is probably rising.
WTI Crude Oil – Daily
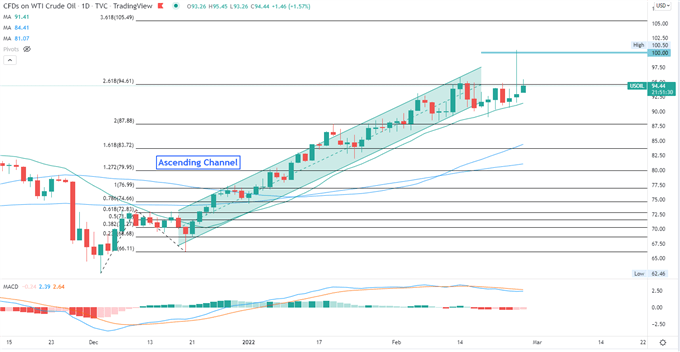
Source: TradingView
Asia-Pacific markets look set to open mixed on Friday following a positive lead on Wall Street.Futures in Japan, Australia, Singapore, India and Indonesia are in the green, whereas those in mainland China, Hong Kong, South Korea, Taiwan, Malaysia and Thailand are in the red.
Alibaba reported quarterly earnings that fell slightly short of market expectations. Revenue came in at 242.6 billion yuan, compared to a 246.4 billion yuan estimate. EPS came in at 16.87 yuan, versus a 16.18 estimate. The 10% YoY growth in revenue is the slowest pace of growth since the company is listed in 2014. The e-commerce giant is facing multiple headwinds including a slowing economy, tepid consumer spending, intensified competition and regulatory scrutiny. Alibaba’s share price has fallen over 60% from its 2020 peak.
Looking back to Thursday’s close, 7 out of 11 S&P 500 sectors ended higher, with 61.6% of the index’s constituents closing in the green. Information technology (+3.45%), communication services (+3.13%) and consumer discretionary (+2.52%) were among the best performers, whereas defensive-oriented consumer staples (-1.71%) and financials (-1.18%) trailed behind.
Nasdaq 100 Technical Analysis
The Nasdaq 100 index is trending lower within a “Descending Channel” as highlighted on the chart below. Prices formed consecutive lower highs and lows over the past few weeks, underscoring a downward trajectory. An immediate support level can be found at 13,660 – the 161.8% Fibonacci extension. The MACD indicator is flattening beneath the neutral midpoint, suggesting that the overall momentum remains weak.
Nasdaq 100 Index– Daily Chart
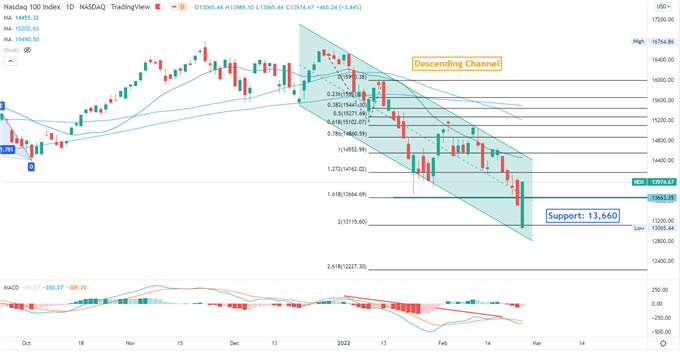
Source: TradingView
Hang Seng Index Technical Analysis
The Hang Seng Index (HSI) breached below an “Ascending Channel” as highlighted on the chart below, suggesting that near-term trend has turned bearish. Prices are testing an immediate support level of 22,800 – the previous low seen in the end of December and early January. Holding above this level may pave the way for a technical rebound. The MACD indicator formed a bearish crossover and trended lower, underscoring bearish momentum.
Hang Seng Index – Daily Chart
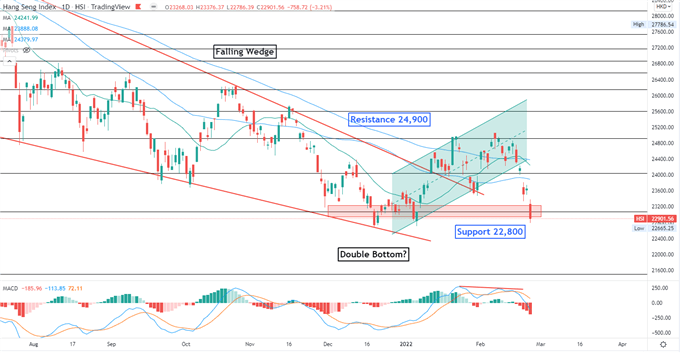
Source: TradingView
ASX 200 Index Technical Analysis
The ASX 200 index formed a “Double Top” chart pattern and has since entered a technical correction. Prices formed a bearish long-range bar on Thursday, underscoring downward momentum. An immediate support level can be found at 6,960 – the 23.6% Fibonacci retracement. Breaching below this level may intensify near-term selling pressure and expose the next support level of 6,758. The MACD indicator formed a bearish crossover, suggesting that a technical correction is underway.
ASX 200 Index – Daily Chart
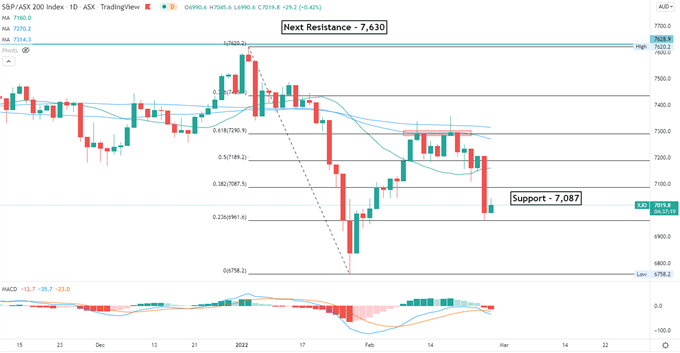
Source: TradingView
This information has been prepared by DailyFX, the partner site of IG offering leading forex news and analysis. This information Advice given in this article is general in nature and is not intended to influence any person’s decisions about investing or financial products.
The material on this page does not contain a record of IG’s trading prices, or an offer of, or solicitation for, a transaction in any financial instrument. IG accepts no responsibility for any use that may be made of these comments and for any consequences that result. No representation or warranty is given as to the accuracy or completeness of this information. Consequently, any person acting on it does so entirely at their own risk.
Margaret Yang | Strategist, DailyFX, Singapore | Publication date: Friday 25 February 2022 14:26


0 Comments
Recommended Comments
There are no comments to display.
Create an account or sign in to comment
You need to be a member in order to leave a comment
Create an account
Sign up for a new account in our community. It's easy!
Register a new accountSign in
Already have an account? Sign in here.
Sign In Now