Australian Dollar down on Russia sanctions, ignores retail sales data. RBA eyed ahead
The Australian Dollar remains vulnerable despite strong retail sales data; AUD opened the week lower as demand for US Dollars dominated markets and the deteriorating situation in Ukraine is evolving. Where to for AUD/USD?

Source: Bloomberg
The Australian Dollar remained under pressure despite Australian month-on-month retail sales rising by 1.8% for January, against 0.3% expected and a prior number of -4.4%.
The solid number is likely a result of the further easing of restrictions as the nation emerges from the Covid-19 pandemic.
Private credit data also hit the wires, with the month-on-month number coming in at 0.6% for January, against 0.7% forecast and the previous print of -4.4%.
However, the market is focused on the unfolding events around the military conflict in Ukraine.
The fallout of excluding Russia from the international payment system, SWIFT, has yet to be fully revealed, but there are reports emerging that several Russian banks could fail in the coming days.
Other sanctions appear to be likely to be announced in the days ahead. This uncertainty could see the Aussie subject to higher than usual volatility.
In periods of uncertainty the Australian Dollar can be exposed as investors seek so called “safe haven” assets, such as the US Dollar.
The Japanese Yen may also benefit in this risk-off environment and the AUD/JPY cross rate might be worth watching to gauge market sentiment.
The RBA will meet on Tuesday and are expected to keep rates on hold. While the asset purchase program was deleted at the last meeting, the market will be focused on any announcement regarding the future of the assets they already own.
The general consensus is that they are likely to let these assets mature, rather than sell them back to the market.
Fourth quarter Australian GDP data is due out on Wednesday, the market is anticipating 3% growth for the period.
AUD/USD technical analysis
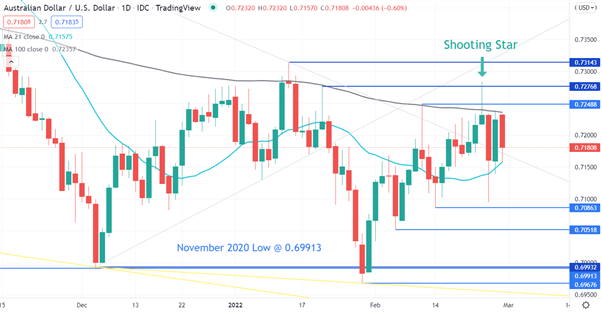
On Wednesday last week, AUD/USD broke above 2 previous highs and the 100-day simple moving average (SMA).
It then retreated back below them to then create a shooting star candlestick pattern which could signal a reversal.
The previous highs of 0.72488, 0.72768 and 0.73143 as well as the 100-day SMA may continue to offer resistance.
Support might be at the recent lows of 0.70863, 0.70518 and 0.69676.
The 21-day SMA could also provide support, a close below it may indicate bearish momentum.

Source: TradingView
This information has been prepared by DailyFX, the partner site of IG offering leading forex news and analysis. This information Advice given in this article is general in nature and is not intended to influence any person’s decisions about investing or financial products.
The material on this page does not contain a record of IG’s trading prices, or an offer of, or solicitation for, a transaction in any financial instrument. IG accepts no responsibility for any use that may be made of these comments and for any consequences that result. No representation or warranty is given as to the accuracy or completeness of this information. Consequently, any person acting on it does so entirely at their own risk.
Daniel McCarthy | Strategist
28 February 2022


0 Comments
Recommended Comments
There are no comments to display.
Create an account or sign in to comment
You need to be a member in order to leave a comment
Create an account
Sign up for a new account in our community. It's easy!
Register a new accountSign in
Already have an account? Sign in here.
Sign In Now