Kingfisher’s share price drops more than 5% despite record revenue and profits

Entry posted by MongiIG in Market News
1,054 views
Kingfisher’s share price slid today, despite pre-tax profit jumping 33.1% and the company reporting record annual revenue and profits.
 Source: Bloomberg
B&Q owner, Kingfisher did extremely well across the pandemic as it continues to gain market share in both the UK and France, but the company predicted a profit drop after its record year which triggered today’s 5% sell-off.
Kingfisher reported a 9.7% rise in total sales for the year, to £13.2 billion, while pre-tax profit rose 33.1% to £1 billion. The dividend has been lifted to 12.4p per share, up by just over 50%.
Kingfisher’s share price declined by around 30% from its early January high at around the 360 pence mark, having accelerated lower when Russia invaded Ukraine, since the company’s exposure to Poland represents 13% of group sales.
The stock fell to levels last seen in August 2020 at 247.2p as investors worried about Kingfisher’s ability to deliver a strong performance against a backdrop of consumers rotating away from home spend as inflation bites, on top of a weak macro-economic outlook.
The company’s shares did recover in line with most global equity markets, however, as the war in Ukraine takes a back seat.
 Source: ProRealTime
In early March, the share price briefly slid through the 200-week simple moving average (SMA) at 255.13p, to the October 2018 and April 2019 highs at 247.2p, before forming a Doji on the weekly candlestick chart.
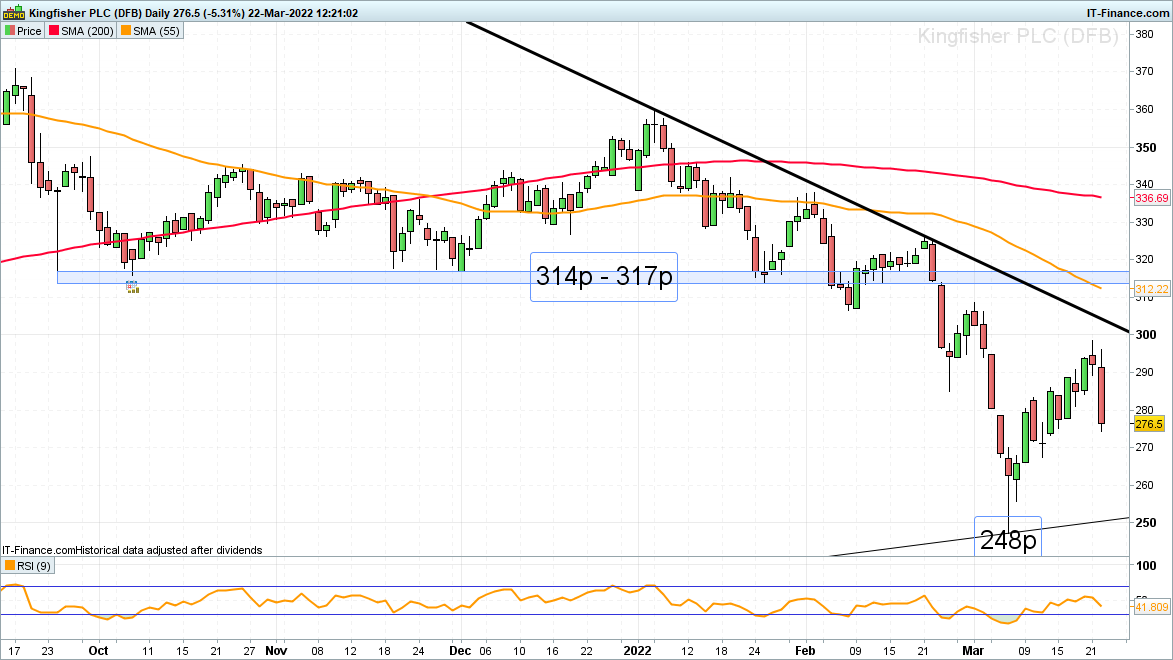
This has been followed by a bullish candle last week which propelled the share towards the minor psychological 300p mark and the 2022 downtrend line at 304p before today’s sharp sell-off.
The 11 March daily chart Doji low at 267.4p is currently being aimed at. While it isn’t slipped through on a daily chart closing basis, the Kingfisher share price may recover and a gradual advance lasting several weeks could still unfold.
For this to happen, this week’s high at 298.4p and the downtrend line will have to be exceeded.
 Source: ProRealTime
If so, the 314p to 317p zone should be next in line but should prove difficult to overcome when first tested as it consists of the October 2020 high and September-to-November 2021 lows.
A rise above the next higher late February high at 326p would push the 200-day SMA at 336.69p to the fore.
Failure at 267.4p would put the 248p early March low back on the cards, a fall through which would have bearish implications with the December 2019 high at 227p being targeted in such a scenario.


.jpg.27c55ea07d5a17683fbdbda06b8fcace.jpg)
0 Comments
Recommended Comments
There are no comments to display.
Create an account or sign in to comment
You need to be a member in order to leave a comment
Create an account
Sign up for a new account in our community. It's easy!
Register a new accountSign in
Already have an account? Sign in here.
Sign In Now