Can the FTSE 100 rise further still or is it likely to soon fail?

Entry posted by MongiIG in Market News
684 views
Outlook for the FTSE 100 post Prime Minister, Boris Johnson’s no confidence vote.
 Source: Bloomberg
FTSE 100 starts week higher despite political turmoil
The UK’s political leader, Boris Johnson yesterday evening faced off a vote of no confidence from those within his Conservative Party, winning by 211 to 148 votes to keep him as party leader and Prime Minister.
Nonetheless, the vote showed that 41% of his party have no confidence in his leadership, despite a last-ditch attempt to win support from his back benches with a speech to the 1922 Committee earlier on Monday.
The UK prime minister has been heavily criticised for breaking his government’s lockdown rules and for apparently repeatedly being economical with the truth. Compared to his predecessor, Teresa May, Johnson fares worse. May won her vote of confidence in December 2018, with 200 ministers of parliament voting for her and 117 against, that is to say 37% having no confidence in her leadership.
When considering how long May had left to her premiership, just over five months, questions are asked about how much longer Johnson can cling on.
Does the current political turmoil have any bearing on the FTSE 100’s performance?
The answer seems to be no, or only to a minor extent, since the index is one of the few which is trading back in positive territory for the year, helped by its large energy and commodity constituents such as Shell, BP and Rio Tinto.
 Source: ProRealTime
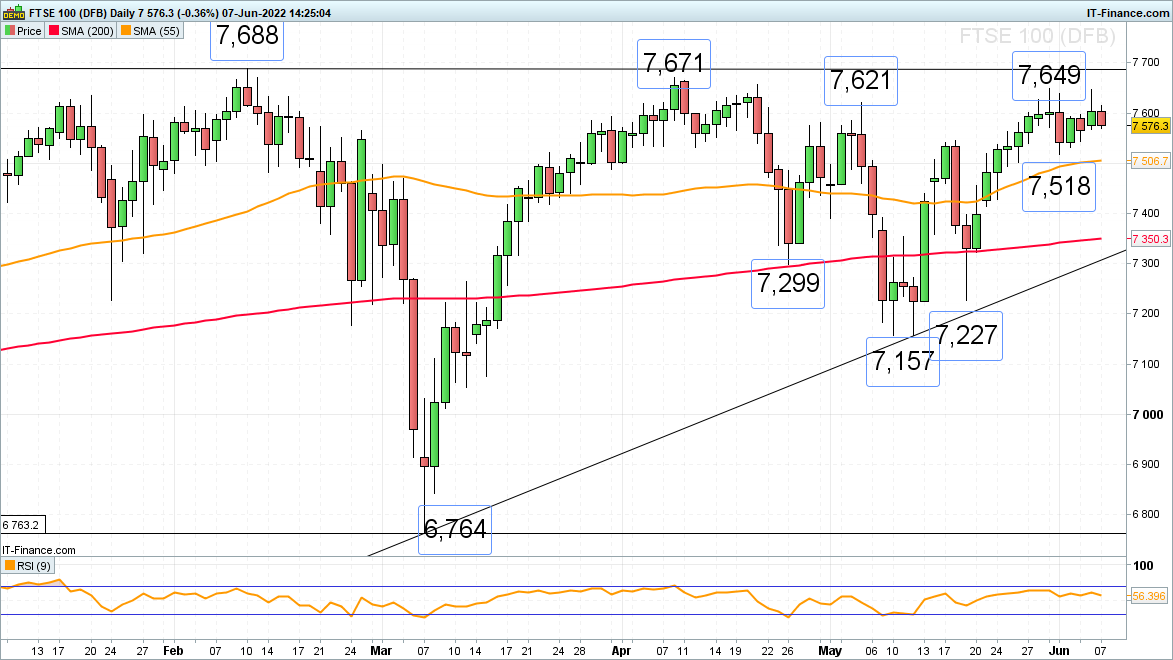
The FTSE 100 continues to gradually advance but is approaching key long-term resistance at 7,648 to 7,690 which is likely to thwart any further advance, at least in the course of this week.
It consists of the January 2020 as well as this year’s February, April, May and current June highs and as such is likely to cap. Having said that, while global risk-on sentiment retains the upper hand, as it has done for the past couple of weeks, and while last week’s low at 7,518 underpins on a daily chart closing basis, overall upside pressure should be maintained as traders continue to speculate on how aggressive Western monetary tightening will need to be to lower inflation.
 Source: ProRealTime
An advance and daily chart close above the 7,690 January 2020 peak would engage the July 2019 high at 7,730. Failure at the 7,518 on a daily chart closing basis may lead to another down leg taking shape with the 200-day simple moving average (SMA) and the March-to-June uptrend line at 7,350 to 7,316 being back in the picture.
Today’s session is being dragged down by US equities with Target announcing their second profit warning in three weeks and trading significantly lower in pre-market trading, leading to other US retailers such as Walmart also slipping.


.jpeg.98f0cfe51803b4af23bc6b06b29ba6ff.jpeg)


0 Comments
Recommended Comments
There are no comments to display.
Create an account or sign in to comment
You need to be a member in order to leave a comment
Create an account
Sign up for a new account in our community. It's easy!
Register a new accountSign in
Already have an account? Sign in here.
Sign In Now