Three markets to watch: AUD/USD, JPY/USD and Bitcoin

Entry posted by MongiIG in Market News
718 views
Uncertainty has become a new norm for the global and domestic economy. Today we look into the following markets: AUD/USD, JPY/USD and Bitcoin.
 Source: Bloomberg
On Tuesday, the RBA caught the market off guard by announcing a 50bps rate rise following the June board meeting, it is without a doubt the largest rate increase in 22 years and the first back-to-back hike in 12 years.
Meanwhile, the World Bank forecasts the world economy will expand by 2.9% in 2022, a much slower rate than last year's predicted 5.7%. The World Bank admits that the world economy is now facing simultaneouse flying inflation and slow growth, a combination that could potentially drag the economy into the stagflation cycle.
As uncertainty becomes a new norm, we look at the following markets: AUD/USD, JPY/USD and Bitcoin.
AUD/USD
The Australian dollar spiked immediately after the RBA lifted the cash rate by 50 basis points to 0.85% from 0.35%. Shortly after, the AUD/USD made a sharp U-turn and closed with a 0.45% loss.
The Reserve Bank of Australia is tipped to lift the cash rate further in July and toward the end of the year to curb inflation. As a result, the futures market is implying a massive upgrade to the interest rate outlook from 2% to over 3% by December.
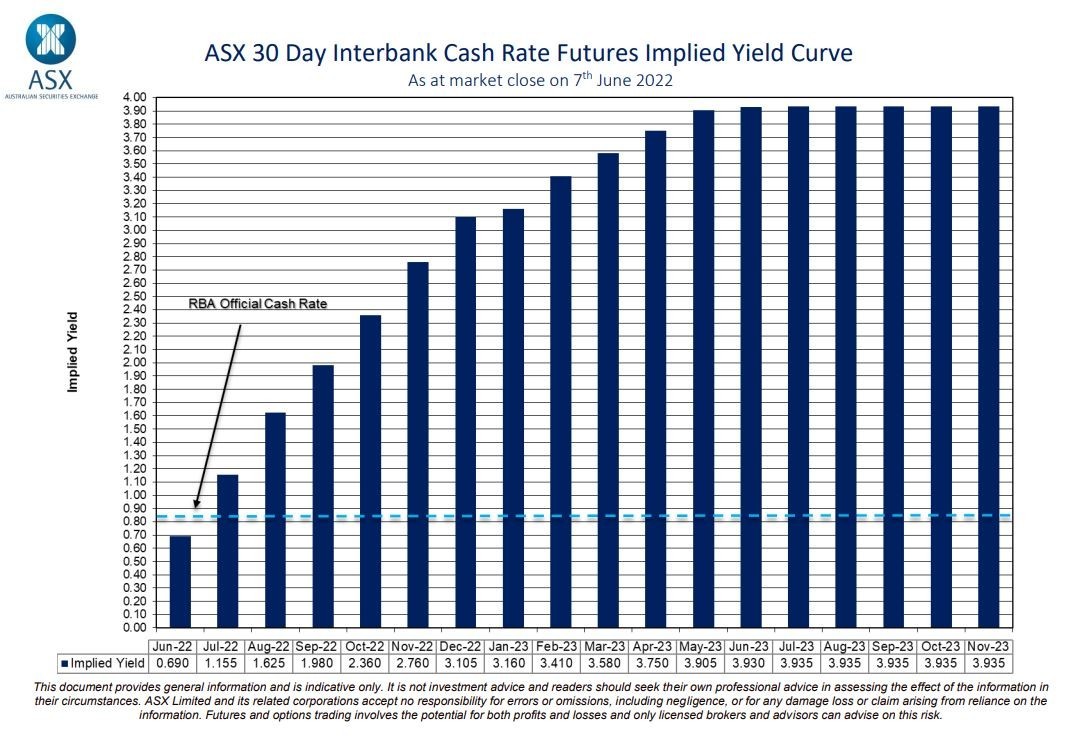 Source: ASX
The next big event for the pair will be this Friday’s US consumer price data.
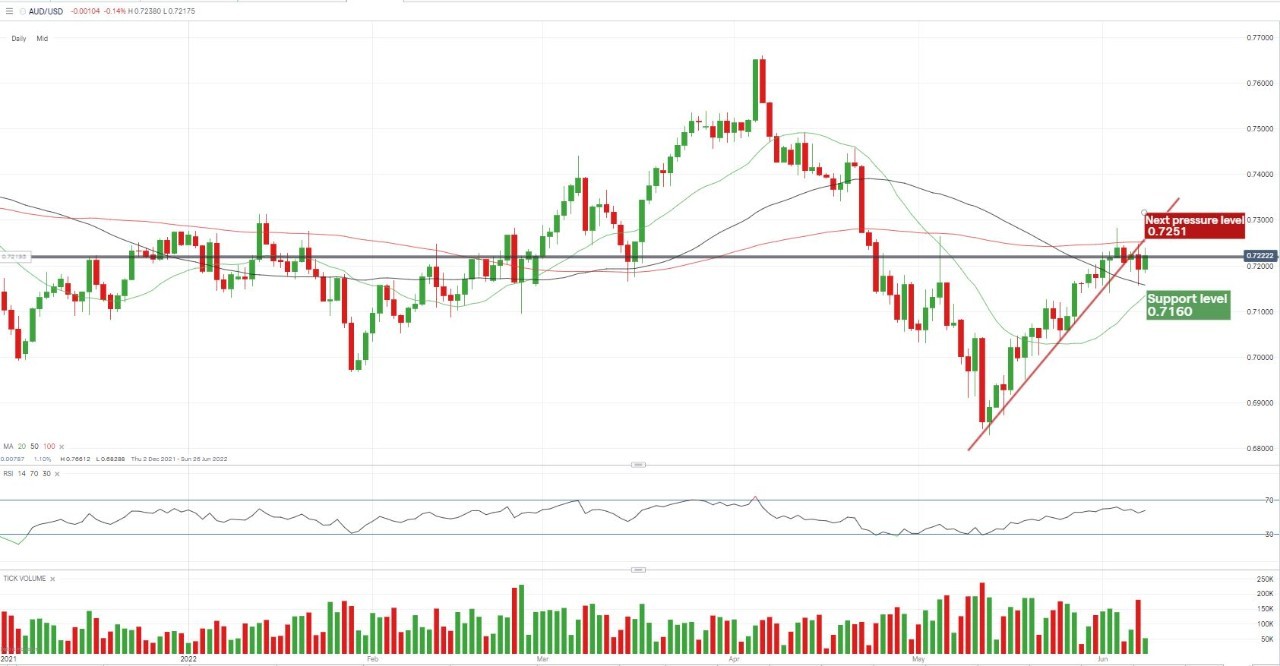
The technical landscape reflects the market sentiment with the AUD/USD moving sideways from the month-long ascending trend line. Today we have seen a slightly stronger Australian dollar working hard to stand back on 72 cents.
Bulls will be awaiting the US CPI print on Friday, which, if comes out to be lower-than-expected, could provide some value for the pair. Resistance will be looking at the previous trendline and the 100 days moving average at 0.7251 before the Feb high at 0.7269 comes into focus. Support appears at 0.7160, where the current 50- and 20-days moving average meets.
 Source: IG
JPY/USD
The Bank of Japan is now the only central bank among developed nations to take a different pathway on monetary policy. In a speech on Monday, Bank of Japan Governor Haruhiko Kuroda reaffirmed that policy tightening still wasn’t on the table for Japan, reasoning that the economy still needs more time to recover. In contrast, the US, UK, Australia, and even ECB are expected to take a further moves to fight their own inflation pain.
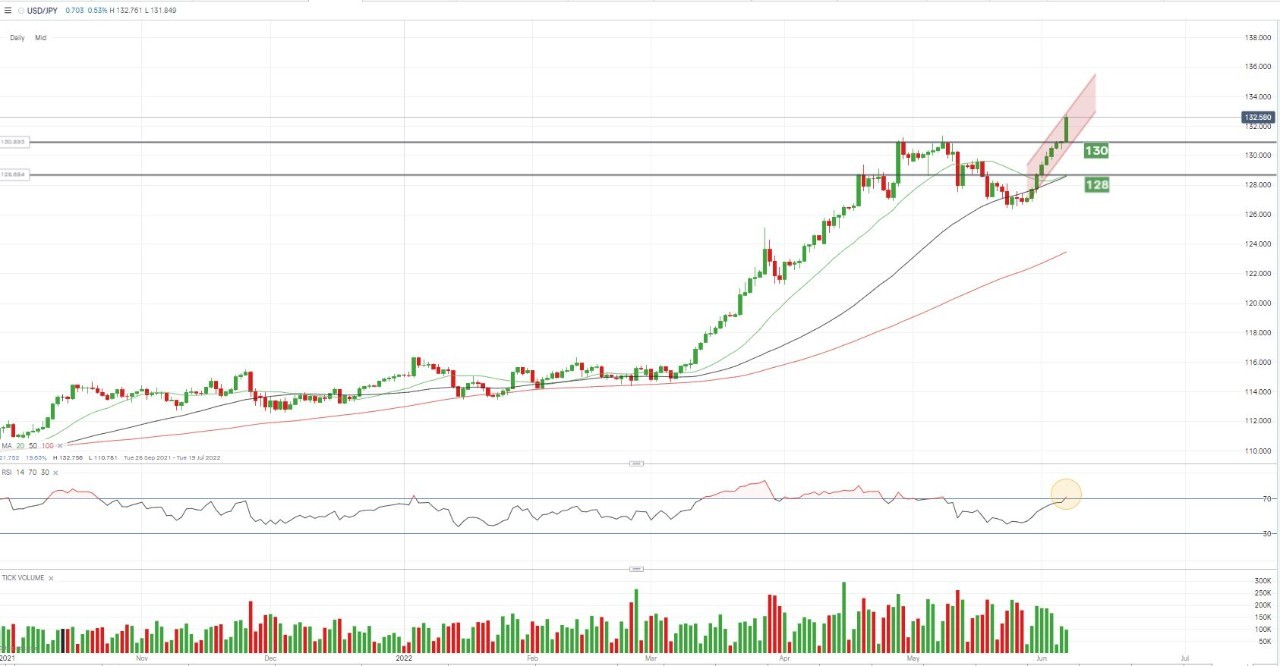
The U.S. Dollar Index, which tracks the currency against a basket of others, has jumped up roughly 13% over the past 12 months. As a result, the continuously widening gap between the Japanese and the US’s rate outlook has pushed the yen to a twenty-year low against the dollar. The exchange rate has jumped up to 131.86 per US dollar, the highest since April 2002.
The next big event for the pair is the US CPI this Friday and the FOMC meeting decision next week. The Fed is determined to take a more aggressive approach and the outlook for the yen will look to the south and seek a support between 128 to 130.
The oversold signal from the RSI print also supports a short-term breath in this case. On the other hand, hotter-than-expected inflation data is likely to top up the fuel tank for the pair to seek a higher bar.
 Source: IG
Bitcoin
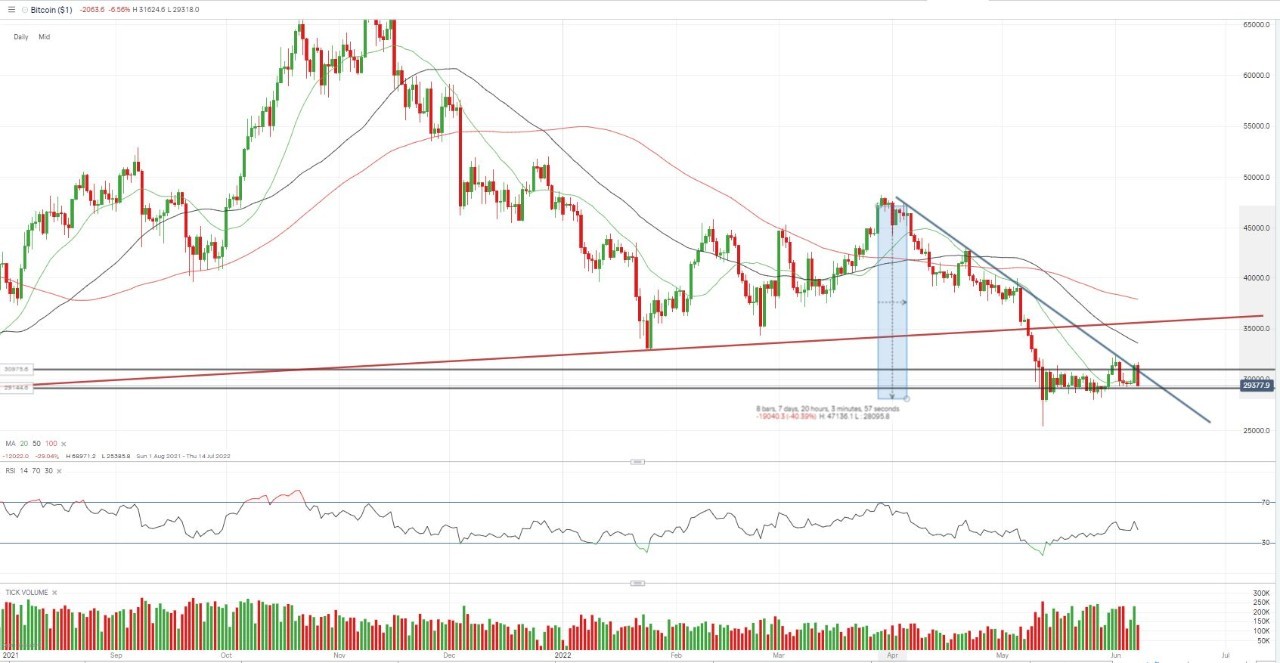
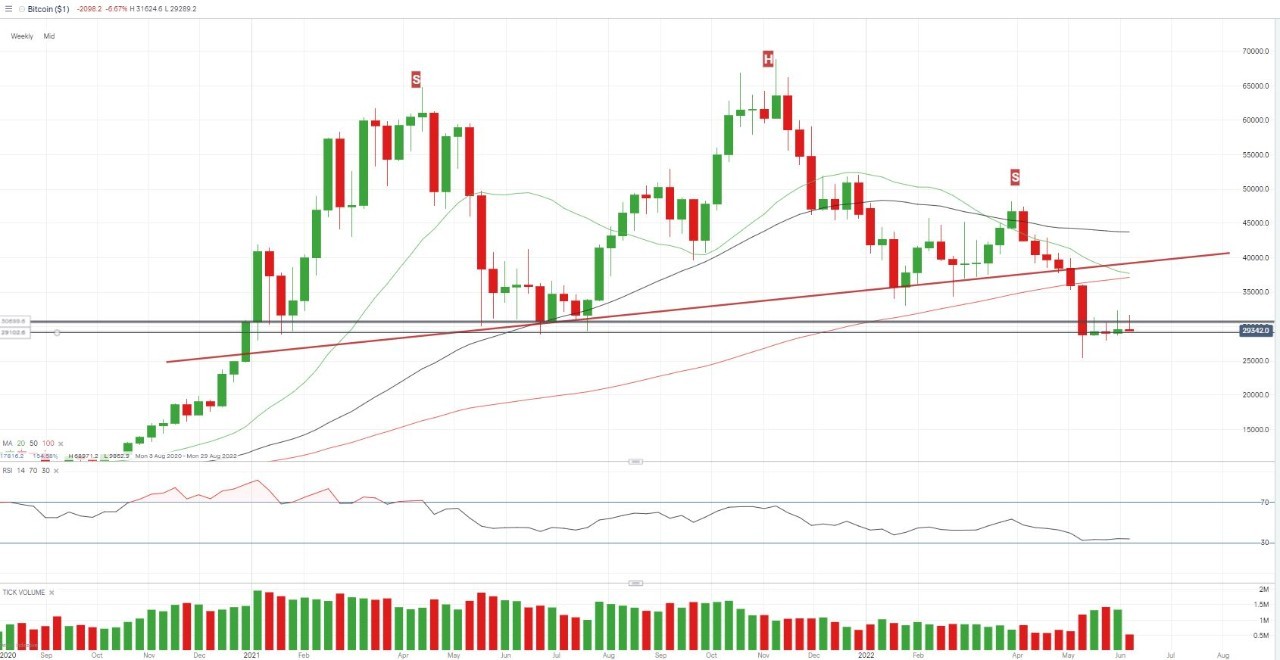
Bitcoin has experienced a turbulent year with the price dropping over 40% in two months. Over the past two weeks, the price has been hovering in the band between the $28K and $31K range. Bearish momentum is still valid but for the time being, it’s probably too early to call a bottom yet.
The broad crypto community has been stuck in a rut for most of 2022, mainly under the whammy from a worrying cocktail mixed with the tightening monetary environment, the fear of a recession, and the fading sentiment form of risk-taking. Hence, investors need to be extra careful before any easing sign surfaces for those significant headwinds.
Let’s look at the short-term picture. The resistance line sits around 31K, which is in line with the support back in early 2021 and will be a key watch. Only a bullish breakout from this line could be identified as a potential for a likely reversal.
 Source: IG
From a long-term perspective, the weekly chart has printed a clear pattern of head and shoulders shape from early 2021 to early May. That leaves a perfect shoulder line and a neck time to be challenged before an overturn to the current bearish momentum can be expected.
 Source: IG
Take your position on over 13,000 local and international shares via CFDs or share trading – and trade it all seamlessly from the one account. Learn more about share CFDs or shares trading with us, or open an account to get started today.


.jpg.27c55ea07d5a17683fbdbda06b8fcace.jpg)
0 Comments
Recommended Comments
There are no comments to display.
Create an account or sign in to comment
You need to be a member in order to leave a comment
Create an account
Sign up for a new account in our community. It's easy!
Register a new accountSign in
Already have an account? Sign in here.
Sign In Now