Sell-off in Wall Street took a breather: Nasdaq, Nikkei 225, USD/JPY

Entry posted by MongiIG in Market News
489 views
The sell-off in Wall Street took a breather last Friday as outperformance in growth sectors did much of the heavy-lifting, with the Nasdaq up 1.43%.
 Source: Bloomberg
Market Recap
The sell-off in Wall Street took a breather last Friday as outperformance in growth sectors did much of the heavy-lifting, with the Nasdaq up 1.43%. The gains to end last week may be attributed to some paring of short positions heading into the US long weekend, along with triple witching option expiry potentially driving short-covering. For last week, the S&P 500 was down 5.8% while Nasdaq fell 4.8%.
With the downward trend of US equity markets intact, the stance seems to remain that any rally could be a temporary relief for another market move lower. Economic data continues to point towards slowing economic momentum, with a surprise contraction in US manufacturing output (-0.1% month-on-month versus +0.3% consensus) last week, mirroring the likes of US retail sales the week before (-0.3% month-on-month versus +0.2% consensus). Comments from Treasury Secretary Janet Yellen suggests that ‘unacceptably high’ prices will stick with consumers through 2022 and expectations are for US economy to slow down. Therefore, it seems that any bottoming-out of economic conditions is still some way ahead, failing to provide any sustaining recovery in risk sentiments in the near-term.
With the US equity and bond markets off-trading on Monday, there may be less indication of overall risk sentiments with lighter trading volume to start the week. That said, volatility may be set to kick in towards the latter half of the week with testimony from Fed Chair Jerome Powell, along with a series of PMI readings from major economies, which will provide indication of economic conditions to address recent market concerns of stagflation.
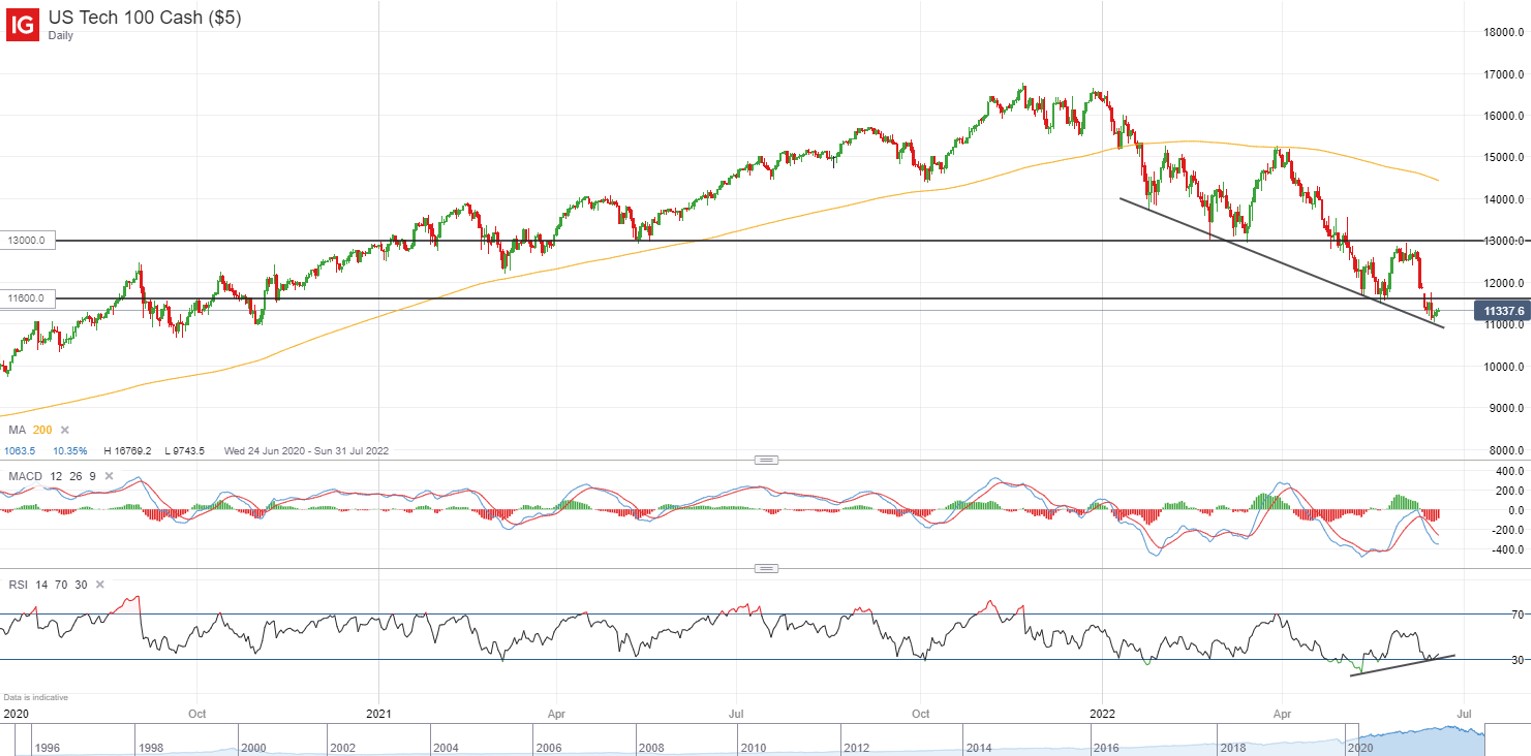
The Nasdaq 100 is attempting to find support at a downward trendline in place since January this year. While a potential bullish divergence in the relative strength index (RSI) may aid in some near-term relief, the overall trend remains downward bias with the series of lower highs and lower lows, with near-term resistance to watch at the 11,600 level.
 Source: IG charts
Asia Open
Asian stocks look set for a mixed open, with Nikkei -0.03%, ASX +0.29% and KOSPI -1.27% at the time of writing. A breather in Wall Street to end last week, along with some positive moves in US equity futures, may provide some relief for the Asia’s trading session but some caution remains with no clear catalyst for now in driving a more sustaining recovery in risk sentiments. US-listed Chinese shares continue to see some optimism, with the Nasdaq Golden Dragon China Index rising 3.2% to end last week and seemingly forming a new higher low.
The release of China’s loan prime rates today saw the People's Bank of China (PBOC) keeping rates unchanged, coming after the PBOC’s decision to refrain from cutting the key rate for its one-year MLF rate last week as well. For now, it seems that liquidity conditions remain sufficient, but loan demand is more restricted by the uncertainty surrounding the authorities’ zero-Covid stance. With that, the PBOC may be awaiting for greater control of Covid-19 risks to drive an economic rebound before making a decision, along with some preferences for fiscal support to lift growth. Further support may still be delivered over the coming months, with the PBOC’s accommodative stance to remain until economic conditions show a further recovery.
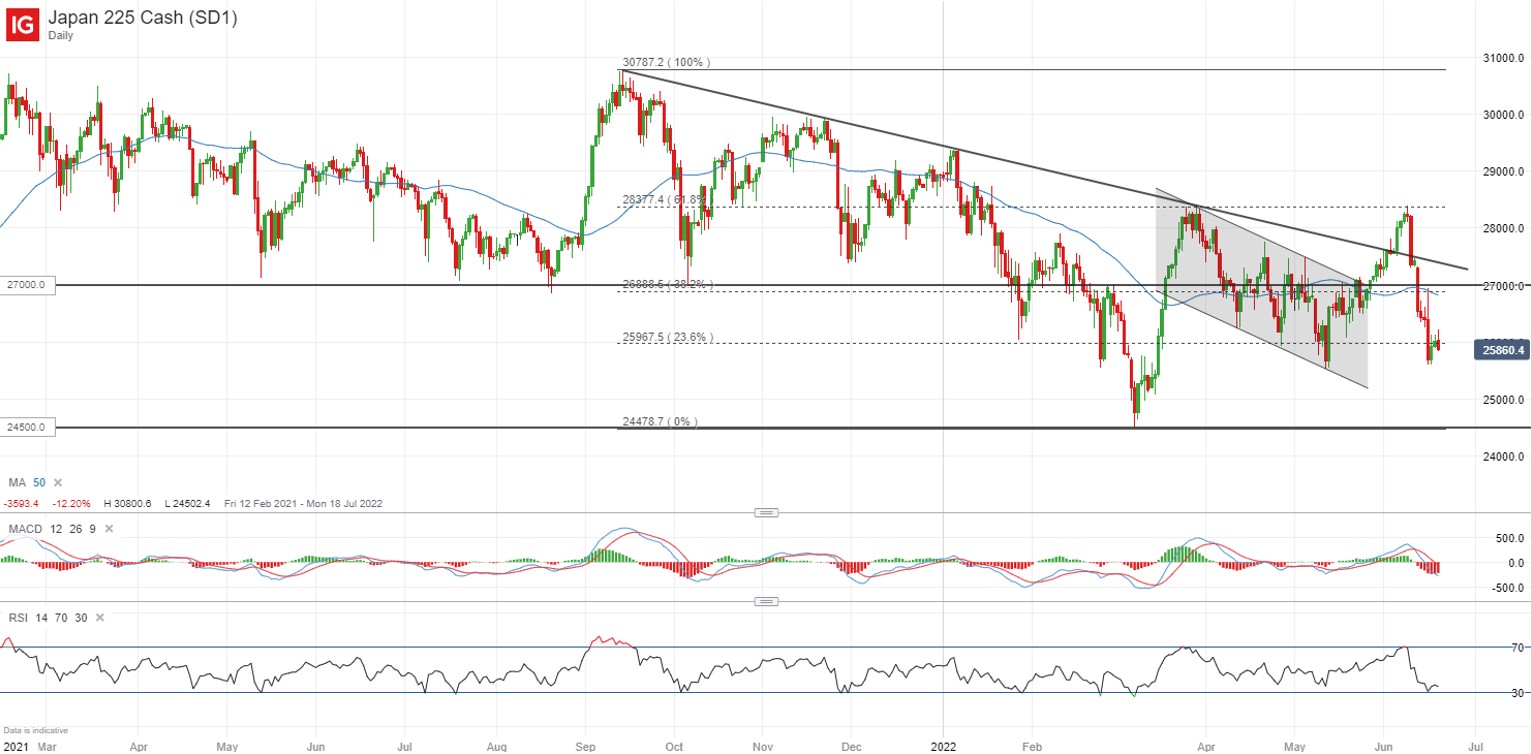
The recent rally for Japan 225 has proven to be short-lived, with the long bearish candlestick bodies last week providing strong testament to the strong presence of sellers with a bearish crossover on the moving average convergence divergence (MACD) indicator. The 26,000 level is currently serving as resistance for the index, where a key 23.6% Fibonacci retracement level resides.
 Source: IG charts
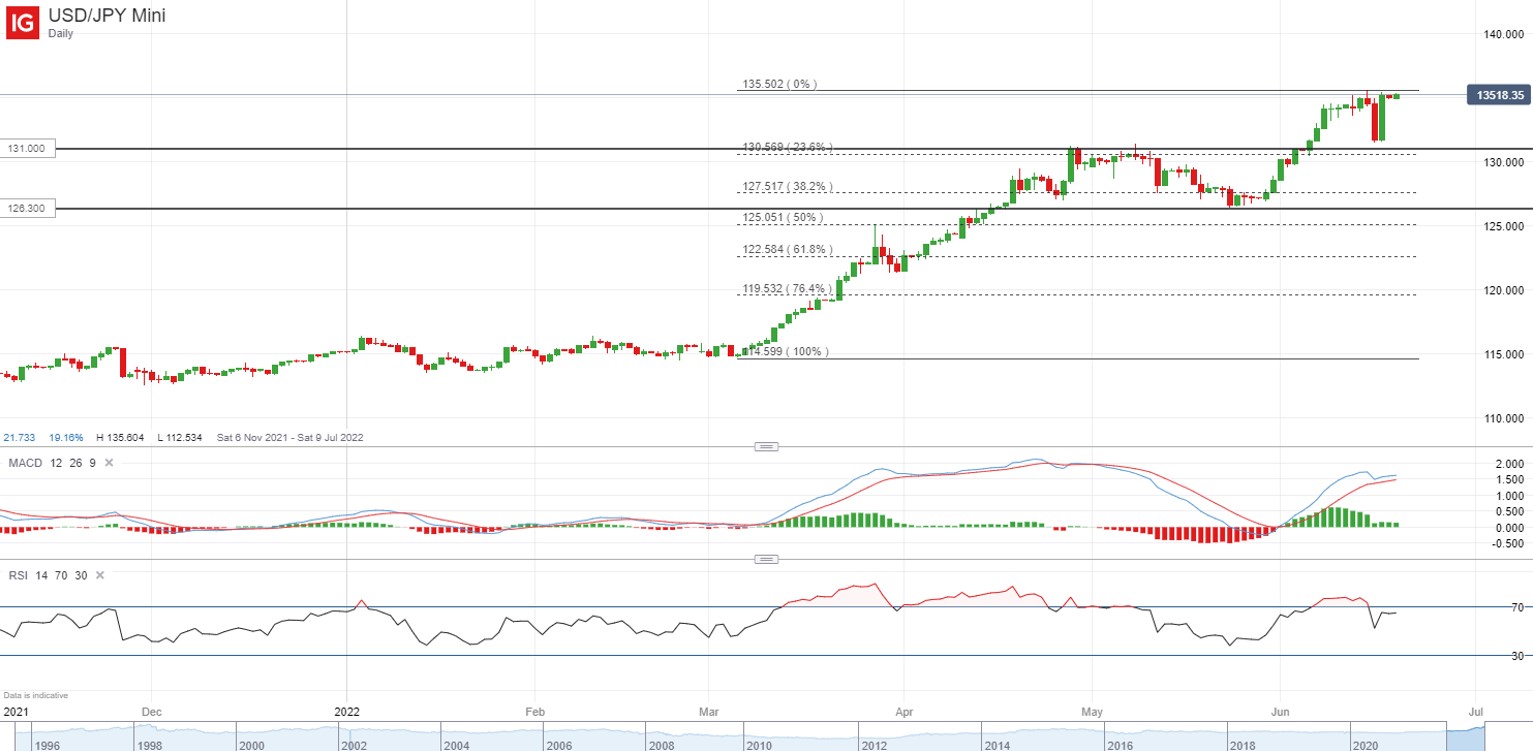
On the watchlist: USD/JPY back to retest 20-year high on Bank of Japan’s continued easing stance
The Bank of Japan (BOJ)’s decision to keep its easing policy stance unchanged last Friday has led to some unwinding of hawkish bets for speculators who were seeking to challenge the BOJ’s status quo, coming after the hawkish surprise from the Swiss National Bank (SNB). For the USD/JPY, a bullish engulfing pattern on the daily chart has brought about a retest of its 20-year high at the 135.50 level, while the latest Commodity Futures Trading Commission (CFTC) data suggests that asset managers has lifted their bearish bets on the yen to a record high last week. The upside for yield differentials is likely to continue over the coming months, with one to watch for any break above the 135.50 resistance in order to unlock further room to the 138.90 level next.
 Source: IG charts
Friday: DJIA -0.13%; S&P 500 +0.22%; Nasdaq +1.43%, DAX +0.67%, FTSE -0.41%


0 Comments
Recommended Comments
There are no comments to display.
Create an account or sign in to comment
You need to be a member in order to leave a comment
Create an account
Sign up for a new account in our community. It's easy!
Register a new accountSign in
Already have an account? Sign in here.
Sign In Now