Are NVIDIA shares staging a lasting comeback?

Entry posted by MongiIG in Market News
472 views
Is NVIDIA's share price in the process of bottoming out?
 Source: Bloomberg
NVIDIA's share price showing first signs of bottoming out
With NVIDIA Corp (All Sessions) shares trading over 50% lower compared to last year’s peak but in one-week highs and having for the first time risen above their three-month downtrend line at $167.40, is now the right time to invest in the chipmaker’s shares?
The semiconductor company’s late May first quarter (Q1) results showed record data centre and gaming revenues alongside solid guided fiscal 2023 second quarter performance, anticipating $8.1 billion in revenues, a near 25% year-on-year increase. With this in mind, it may be of interest to buy the company’s shares at current levels.
Sales for the first quarter of 2022 at the US’s largest chip maker rose 46% to $8.29 billion, up 8% on the previous quarter and its data centre business ended fiscal 2022 on revenue of $13 billion, compared to just $5 billion two years previously.
With a price-to-earnings ratio (P/E) close to 40, compared to over 100 at its peak in 2021, the share remains expensive compared to the broader market – the US 500 historically trades at a P/E of around 15 – but there is still huge potential revenue growth for the world’s market leader in “dedicated” Graphics Processing Units (GPUs) (as opposed to the ones being built into computer processors).
According to the research firm, McKinsey the global market for semiconductors could grow $600 billion to $1 trillion by 2030 as Artificial Intelligence (AI), self-driving vehicles, blockchain, cryptocurrencies and the Metaverse require processing power.
NVIDIA's share price withstands downside pressure despite recession fears
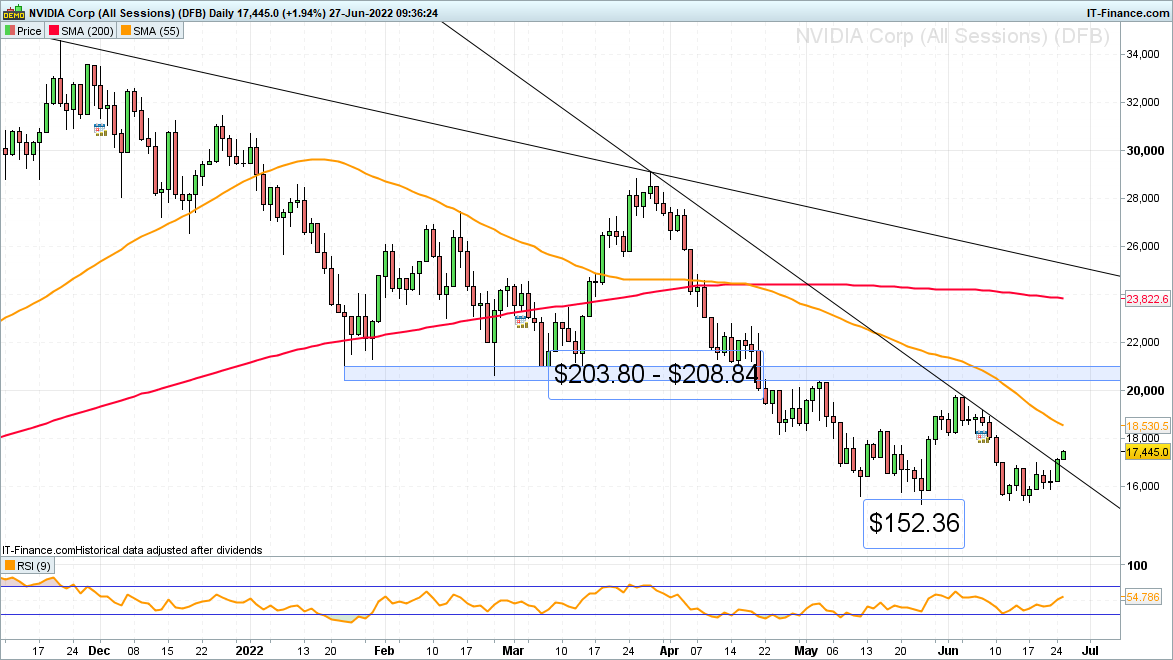
The fact that the NVIDIA share price slipped back to but held marginally above its $152.36 May low despite increased global recession fears which would negatively impact its growth prospects, is a positive for the bulls.
 Source: ProRealTime
In May the company’s founder and CEO, Jensen Huang, said despite “the backdrop of a challenging macro environment…the effectiveness of deep learning to automate intelligence is driving companies across industries to adopt NVIDIA for AI computing.”
He added that NVIDIA is gearing up for “the largest wave of new products in [its] history with new GPU, CPU, DPU and robotics processors ramping in the second half.” He believes his company’s new chips and systems will “greatly advance AI, graphics, Omniverse, self-driving cars and robotics, as well as the many industries these technologies impact.”
Embryonic signs of a bullish technical reversal
It is early days yet but the fact that the NVIDIA share price is trading in one-week highs and, more importantly, has for the first time risen above its three-month downtrend line, is encouraging for those wanting to buy the company’s shares.
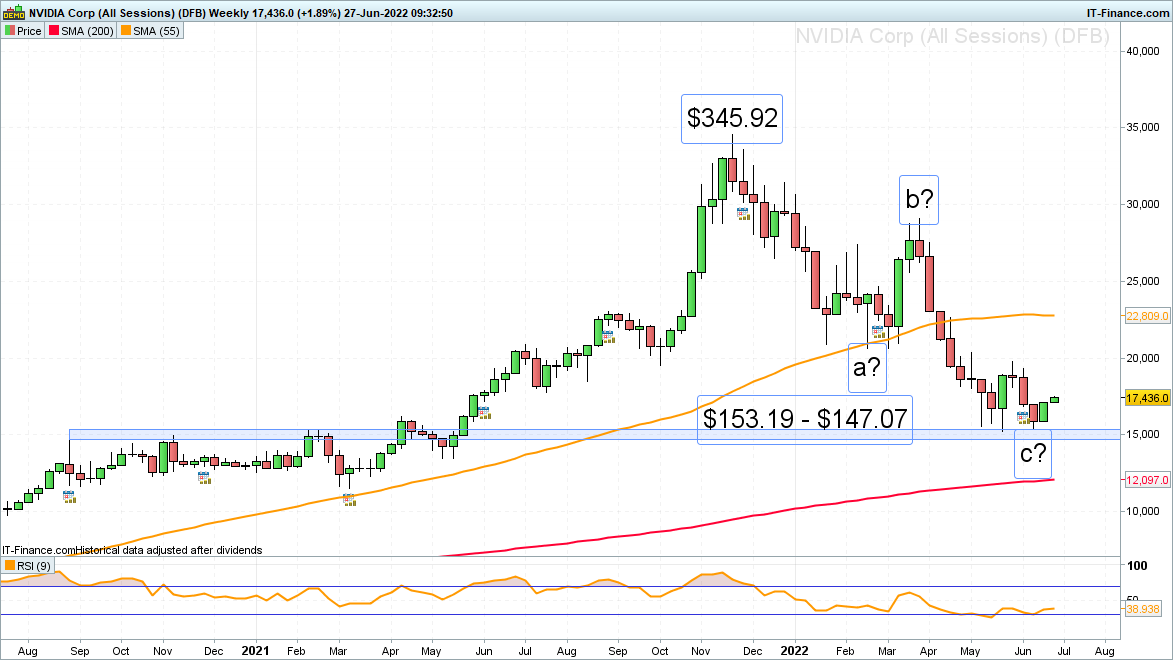
This comes after the NVIDIA share price, for the second time in as many months, managed to bounce off the major long-term $153.19 to $147.07 support zone which consists of the August, November 2020 and February 2021 highs.
It is thus still possible that an Elliott Wave A, B, C correction lower to the downside ended in May. If this were to indeed be the case, an eventual rise above the November peak at $345.92 should ensue.
Immediate upside targets are seen at the April low, mid-May high and along the 55-day simple moving average (SMA) at $181.65 to $183.57, a rise above which would lead to the early June high at $197.63 being targeted.
 Source: ProRealTime
A medium-term bottoming formation would be confirmed by a daily and weekly chart close above the slightly higher January-to-March lows and the early May high at $203.80 to $208.84 being exceeded.
If so, the 200-day SMA at $238.22 would be back in the firing line.
The $203.80 to $208.84 resistance area is key for the medium-term trend as failure around it and a subsequent drop through the $153.19 to $147.07 support zone would mean that the current advance has simply been another corrective countertrend move with the downtrend, which began in November, in this scenario expected to continue over the coming months, targeting the 200-week SMA at $120.97.


0 Comments
Recommended Comments
There are no comments to display.
Create an account or sign in to comment
You need to be a member in order to leave a comment
Create an account
Sign up for a new account in our community. It's easy!
Register a new accountSign in
Already have an account? Sign in here.
Sign In Now