US equity markets running risk of forming a new lower high: Nasdaq 100, STI, AUD/USD

Entry posted by MongiIG in Market News
1,030 views
Initial gains in US equity markets failed to hold, with selling pressure present throughout the trading session as the risk of a new lower-high formation for US indices appears to be materialising.
 Source: Bloomberg
Market Recap
Initial gains in US equity markets failed to hold, with selling pressure present throughout the trading session as the risk of a new lower-high formation for US indices appears to be materialising. The underperformance in US consumer confidence seems to be the trigger, falling sharply to 98.7 in June from a downwardly revised figure of 103.2 in May while consensus is at 100. Rising prices continue to take a toll on consumer spending intentions, while ongoing rate hikes from the Fed is likely to dim sentiments ahead as well. The US consumers are clearly pessimistic about the economic outlook, with forward-looking expectations (66.4 versus 73.7 in May) at its lowest level since 2013.
While the relief rally was previously hoping to tap on some reprieve in inflation ahead, the narrative continues to be challenged with oil prices moving higher, while a gauge of US home prices increased 21.2% (consensus of 21%) year-on-year (YoY) in April and is likely to point towards shelter costs being elevated-for-longer. An aggressive path of rate increases was also laid out by New York Fed President John Williams (a Fed policy voter), who guided for a range of 3% to 3.5% this year and 3.5% to 4% next year as a ‘perfectly reasonable projection’. The overnight sector performance only saw the energy sector in the green, while the growth sectors retraced more aggressively potentially due to its greater outperformance over the past two weeks. This may also come as the Nasdaq 100 index hits a critical confluence of resistance at the 12,200 level, where a support-turned-resistance lies in place with a downward trendline. The retracement drives the risks of forming a new lower high, further validating the ongoing downward trend since the start of the year and leaving the 10,900 level on watch next.
 Source: IG charts
Asia Open
Asian stocks look set for a negative open, with Nikkei -1.30%, ASX -1.16% and KOSPI -1.51% at the time of writing. There were some optimism in the Asia session yesterday as China’s recent move to shorten quarantine period for inbound travellers provide hopes of an ongoing shift away from its strict virus stance, which has been the key obstacle to its economic growth. That said, broad-based losses in Wall Street will likely strike a cautious tone in today’s session, as underperformance in US growth sectors may have a knock-on impact on tech companies in the region as well.
Closer to home, Singapore reported its highest number of daily Covid-19 infections in more than 3 months, with the 11,504 new Covid-19 cases on Tuesday, more than double the 5,309 cases on Monday. For now, the risks of virus restrictions being back in place remains low, with Tuesday’s numbers potentially reflecting spike in infections over the weekend and the headroom in adult intensive care unit (ICU) bed utilisation remains well-positioned to deal with a surge in cases at current point in time.
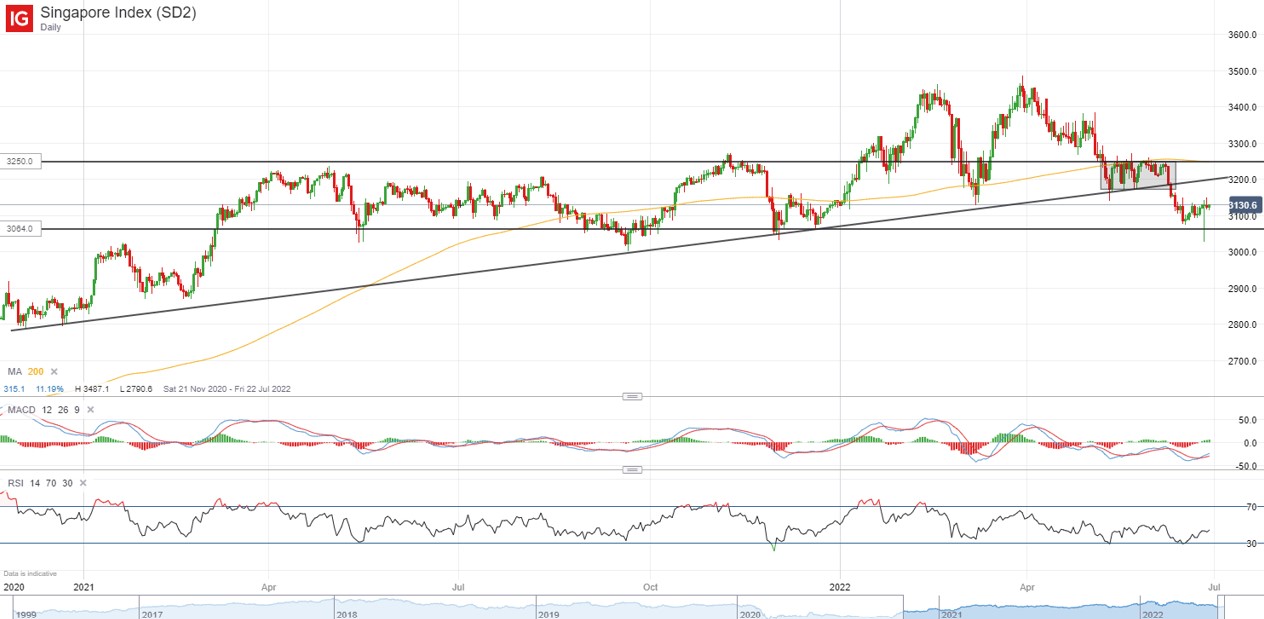
For the STI, the latest SGX fund flow data continues to reflect low institutional interest in the index, with overall net outflows of S$15 million from institutional investors last week. Sectors such as financials and real estate investment trusts (REITs) failed to gain much traction, with the telecommunication sector being the only positive outlier. For the STI, having broken below a key upward trendline in early-June, the index may seem to carry a downward bias, with the series of lower highs and lower lows pointing to an ongoing downtrend. Any retracement could leave the 3,064 level on watch next.
 Source: IG charts
On the watchlist: AUD/USD struggling to move higher
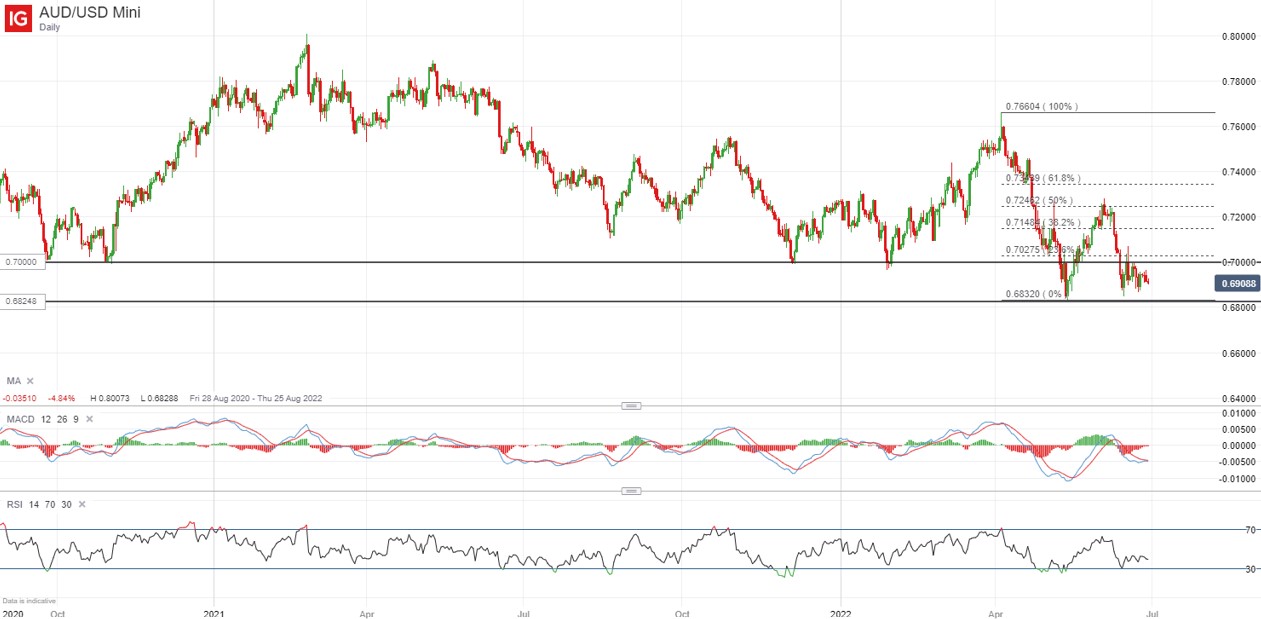
The AUD/USD has been struggling to move higher over the past two weeks as intermittent attempts to rally were short-lived. While news of China’s shortened quarantine period may serve as a positive catalyst for the Aussie dollar, the risk aversion in Wall Street overnight came as a weighing pressure for the risk-sensitive currency against the safe-haven US dollar. The 0.700 level will remain as a key resistance to overcome, where a previous support-turned-resistance lies close to a key 23.6% Fibonacci retracement level. Further risk-off mood in global markets could drive a retest of its two-year low at the 0.683 level next.
 Source: IG charts
Tuesday: DJIA -1.56%; S&P 500 -2.01%; Nasdaq -2.98%, DAX +0.35%, FTSE +0.90%


.jpeg.98f0cfe51803b4af23bc6b06b29ba6ff.jpeg)


0 Comments
Recommended Comments
There are no comments to display.
Create an account or sign in to comment
You need to be a member in order to leave a comment
Create an account
Sign up for a new account in our community. It's easy!
Register a new accountSign in
Already have an account? Sign in here.
Sign In Now