Recent rallies for major US indices hit a roadblock: Nasdaq 100, Hang Seng Index, EUR/USD

Entry posted by MongiIG in Market News
534 views
Major US indices failed to follow through on their recent rallies into the new trading week, as risk aversion quickly took control ahead of the key US CPI data release and the Q2 earnings season.
 Source: Bloomberg
Market Recap
Major US indices failed to follow through on their recent rallies into the new trading week, as risk aversion quickly took control ahead of the key US consumer price index (CPI) data release and the quarter two (Q2) earnings season. Losses were largely concentrated on growth sectors (technology, communication services, consumer discretionary) with big tech reversing heavily on their previous outperformance, while the fall-out in the Twitter deal clearly did little in aiding sentiments as well. On the other hand, resilience in defensive sectors reflected the cautious lean in equity markets and with market breadth for major US indices reverting to more neutral levels over the past week, the justification of equities in oversold conditions seems less pronounced.
The start of the second quarter earnings season and the release of the key US CPI data will be key drivers for risk sentiments this week. For the US CPI, core inflation is expected to continue lower at a 5.7% increase year-on-year (YoY) but consensus for the headline figure to pull ahead to an 8.8% increase from previous 8.6% seems to suggest no clear reprieve overall. The release of results from major US banks will also be a hurdle to overcome, with growth risks expected to be presented in higher loan losses provision while the extent of pass-through from higher interest rates into their net interest income will be on watch for any cushioning of the impending earnings drop. Lacklustre earnings from the major banks, along with any inflation surprise, could be catalysts to weigh on sentiments further.
For the US Tech 100, the formation of a near-term ascending triangle pattern could be in place, with the 12,200 level serving as a key resistance to overcome. Greater resistance could be found at the 12,870 – 13,000 zone, which marks a confluence of several key Fibonacci retracement levels.
 Source: IG charts
Asia Open
Asian stocks look set for a mixed open, with Nikkei -1.40%, ASX +0.59% and KOSPI -0.76% at the time of writing. With fresh fines on Alibaba and Tencent bringing back regulatory jitters, along with the resurgence of virus cases in China, previous dip-buying efforts in Chinese equities are seeing some unwinding, with the downbeat mood likely to linger in today’s session as well. The Nasdaq Golden Dragon China Index has plunged more than 7% overnight, coming in at its lowest level in three weeks. Overall sentiments may also take on a wait-and-see stance, with market participants shunning from taking on excessive risks with the onset of the US earnings season and US inflation data.
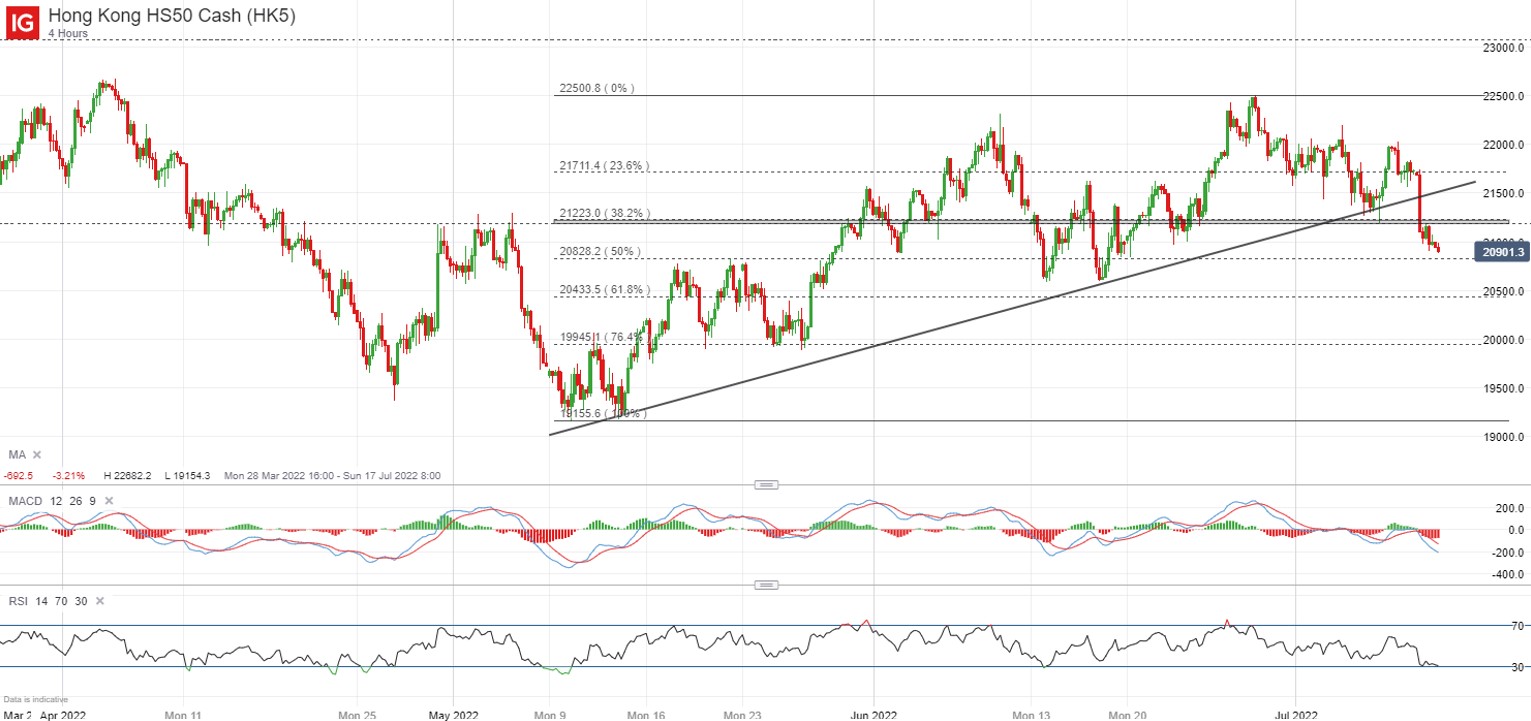
For the Hong Kong HS50 index, a downward trendline connecting higher lows failed to hold following the 2.8% drop in yesterday’s session. A retest of the 21,220 level, where a confluence of Fibonacci retracement levels stands in place, was also met with a bearish rejection. Further retracement could leave the 20,600 level on watch as a line of support, followed by the key psychological 20,000 level.
 Source: IG charts
On the watchlist: EUR/USD reaching parity
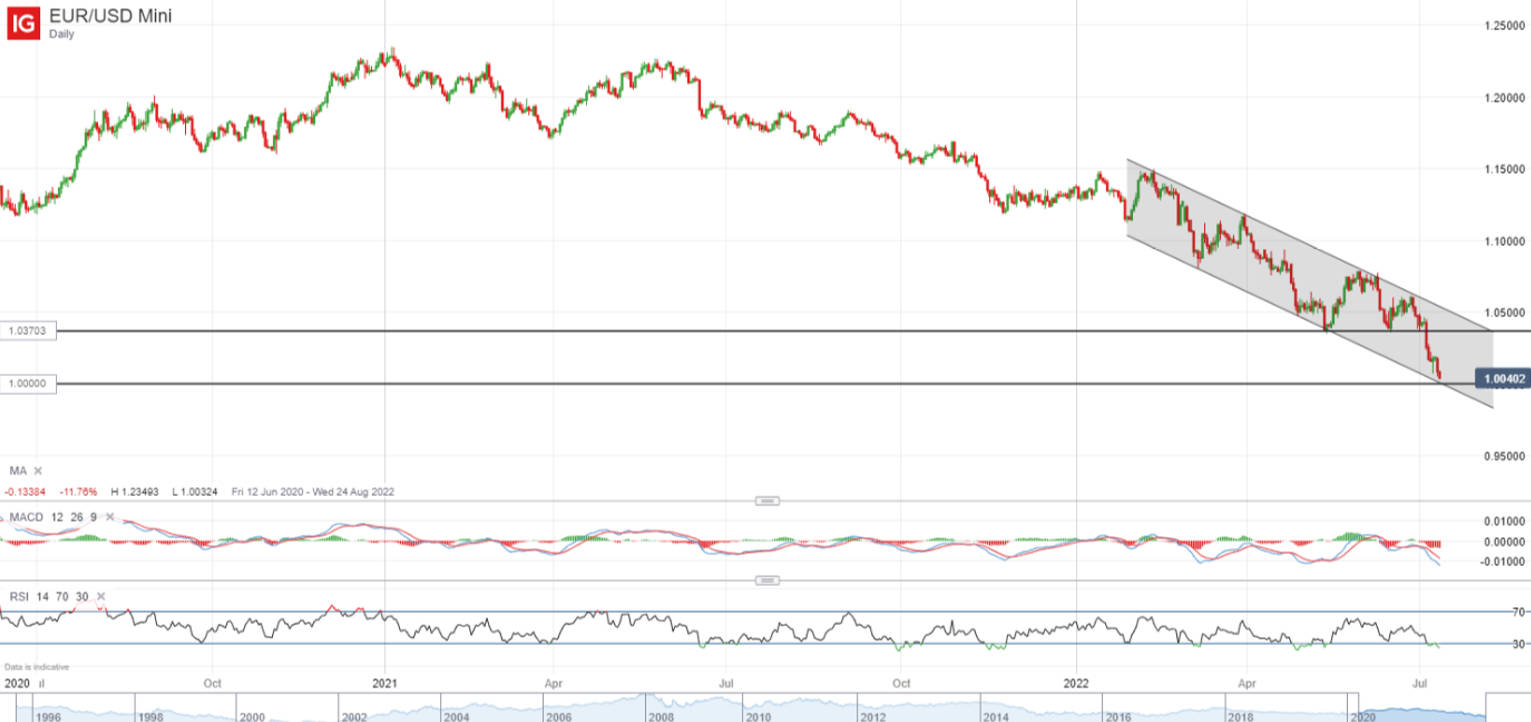
Further strength in the US dollar overnight continues to bring the EUR/USD closer to parity, as a hammer candlestick last week faced difficulty in finding a follow-through, which suggests the strong presence of sellers for the currency pair. Fundamentally, the uncertainty of gas supplies in Germany on what will come after the maintenance of its Nord Stream 1 pipeline adds to the risks of higher-for-longer inflation and recession concerns, which presents headwinds for the euro with no clear resolution in the near-term. The parity level will be on watch over the coming days, which coincides with the bottom trendline of a descending channel pattern from a technical standpoint. While dip-buyers may find significance in holding the parity line, the currency pair risks a downward break below parity, which could then see the pair head lower to the 0.960 level next.
 Source: IG charts
Monday: DJIA -0.52%; S&P 500 -1.15%; Nasdaq -2.26%, DAX -1.40%, FTSE -0.00%


.jpeg.98f0cfe51803b4af23bc6b06b29ba6ff.jpeg)


0 Comments
Recommended Comments
There are no comments to display.
Create an account or sign in to comment
You need to be a member in order to leave a comment
Create an account
Sign up for a new account in our community. It's easy!
Register a new accountSign in
Already have an account? Sign in here.
Sign In Now