Apple Q3 earnings: services expected to grow, but supply issues could stifle revenues
Apple looking to rely on services revenues, as the production and delivery of physical products come under the spotlight thanks to logistical and supply chain issues

Source: Bloomberg
When will Apple report their latest earnings?
Apple report their earnings for their fiscal third-quarter (Q3) post-market on Thursday 28 July, 2022.
What should traders look out for?
Apple shares have been hit hard over the course of 2022, with fears over higher interest rates damaging many of the big US tech names. Expectations of an impending recession do ask questions over demand over the course of this year, while expectations of rising interest rates will provide questions around market valuations.
The chart below highlights how iPhone sales dominate despite attempts to diversify over the years. However, it also points towards the undeniable growth of their services business, which provides optimism for future revenues aside from the need to constantly innovate new market leading products.

Source: Macrumours
There are undoubtedly significant headwinds facing the firm, with a high risk of underperformance or slowing growth as a result. Supply chain issues have been prominent over the course of the first half of 2022, and that is likely to represent one key area of concern for investors.
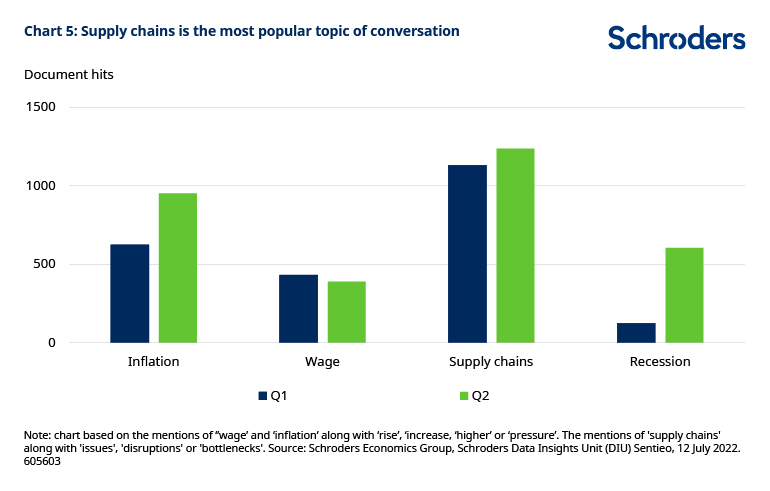
The chart below from Schroders highlights how supply chain problems remain the primary concern for many firms, although we are seeing a sharp rise in mentions of “recession” and “inflation” in recent months. This highlights some of the key issues traders should be looking out for when they attempt to weigh up ongoing and future risks for the firm.

Source: Schroders
With regards to Apple, they certainly have had supply chain issues to overcome across the business. Their operations in China will be particularly in focus as the Chinese ‘zero Covid-19’ policies provide questions around production and demand levels for the quarter. Meanwhile, the Russian sales figure should also be followed to see the impact caused by the recent pause in sales.
Things should look more positive on the services side of the business, with double-digit year-over-year (YoY) growth expected for the fiscal Q3. This is an increasingly important and growing segment of the business that optimists will be watching closely. Services represented 21% of total revenues in Q3 2021, while that figure is forecast to rise to 24% this time around. Thankfully, this is a particularly high margin segment of the business (72.6%).
It is worthwhile noting that the numerous factors impacting Apple from both a demand and supply perspective should provide the grounds for significant volatility away from market expectations come 28 July. The wide spread of analyst estimates does highlight the unpredictability of earnings for the quarter, with the lowest revenue prediction of $78 billion coming well below the $88 billion forecast from the optimistic Elazar Advisors.
For long-term investors, it will be prudent to look towards the company breakdown of why the numbers look a certain way. After-all, there will no doubt be factors in play that will be temporary in nature rather than indicative of long-term concerns.
The latest information coming from Apple ahead of this earnings report points towards a slowing in hiring at the firm, with specific departments seeing lower investment in the face of growing economic headwinds. Thus, traders should look out for any clarity on the size and reasoning behind that decision.
Apple earnings – what to expect
Revenue – $82.53 billion vs $81.43 billion (Q3 2021), and $97.28 billion (Q2 2022).
Earnings per share (EPS) – $1.16 vs $1.30 (Q3 2021) and $1.52 (Q2 2022).
Apple earnings – valuation and broker ratings
Analysts are overwhelmingly positive for Apple stock, with none rating it a ‘sell’ recommendation. Instead, out of 47 analysts, there are 39 ‘strong buy’ or ‘buy’ recommendations, and eight ‘hold’ recommendations.

Source:Eikon
Apple shares – technical analysis
The weekly Apple chart highlights the declines seen over the course of the second quarter of 2022, with the June low of $129.07 representing a 30% decline from the January high. Whether that represents the sum total of this selloff remains to be seen, but the stock has certainly gathered steam in the weeks leading into this earnings release.

Source: ProRealTime
The daily chart highlights how price has managed to rally into the crucial swing-high of $151.71. A push up through that level would bring an end to the bearish trend, pointing towards an extension of this rebound. Watch out for a potential breakdown on the stochastic oscillator through the 80 mark to signal a potential return of the bearish sentiment that has been evident in February and April.
Nonetheless, the fact that we have managed to move out of the pattern of lower highs does instill greater confidence going forward.


.jpeg.98f0cfe51803b4af23bc6b06b29ba6ff.jpeg)
.jpeg.573e1479f76cb6c02faab8d9bd670ff8.jpeg)
0 Comments
Recommended Comments
There are no comments to display.
Create an account or sign in to comment
You need to be a member in order to leave a comment
Create an account
Sign up for a new account in our community. It's easy!
Register a new accountSign in
Already have an account? Sign in here.
Sign In Now