Daily brief: Australian dollar falls alongside copper and iron ore ahead of RBA minutes

Entry posted by ArvinIG in Analyst Article
418 views
The RBA’s August policy minutes in focus ahead of wage data due out later this week and AUD/USD approaches the 0.7000 psychological level after a big overnight drop.

Source: Bloomberg
Tuesday’s Asia-Pacific outlook
A stronger US dollar weighed on the Australian dollar after poor US economic data added to recession fears. The New York Fed’s Empire State Manufacturing Index for August fell to -31.3 on weak new orders and shipments. US stocks opened lower but trimmed losses throughout the Wall Street trading session. The benchmark S&P 500 ended 0.40% higher as Fed pivot bets strengthened some.
On Monday, China reported weaker-than-expected retail sales and industrial production data for July. China’s central bank, the People’s Bank of China (PBOC), unexpectedly lowered its 1-year medium-term lending facility rate by 10 basis points. The surprise move sparked demand for Chinese government bonds, sending China’s 10-year yield to its lowest level since January. The yuan weakened more than 1% against the USD.
Crude oil prices fell in New York trading despite China’s signal of support for its economy. WTI crude and Brent crude prices slipped nearly 3%. Copper and iron ore prices also came under pressure, which weighed on the commodity-sensitive Australian dollar. In Europe, natural gas prices surged as the Rhine River saw its water level drop further. German 1-year ahead energy prices hit another fresh record high.
The Reserve Bank of Australia (RBA) will release its August policy minutes today, which may provide markets with additional insight into the central bank’s thinking. Australia’s second-quarter wage price index is expected to climb from 2.4% y/y to 2.7% y/y later this week. A larger-than-expected increase would likely fuel some hawkish RBA bets to the Aussie dollar’s benefit. Melbourne-based BHP Group’s second-half earnings are also due this morning.
Notable events for August 16:
- Philippines – Retail Price Index (May)
- Japan – Tertiary Industry Index MoM (June)
- India – WPI Food YoY (July)
AUD/USD technical outlook
AUD/USD pierced below its 100-day Simple Moving Average and prices look poised to test the 0.7000 psychological level at the current calculus. The 12-day Exponential Moving Average (pink line) offered some intraday support shortly above the psych level. A break below those levels would threaten to drag prices negative for the month. The Relative Strength Index (RSI) is tracking lower towards its centerline.
AUD/USD daily chart
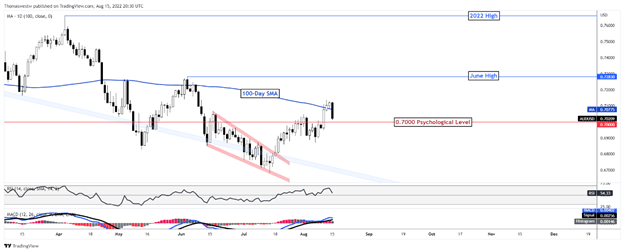
Source: TradingView
This information has been prepared by DailyFX, the partner site of IG offering leading forex news and analysis. In addition to the disclaimer below, the material on this page does not contain a record of our trading prices, or an offer of, or solicitation for, a transaction in any financial instrument. IG accepts no responsibility for any use that may be made of these comments and for any consequences that result. No representation or warranty is given as to the accuracy or completeness of this information. Consequently any person acting on it does so entirely at their own risk. Any research provided does not have regard to the specific investment objectives, financial situation and needs of any specific person who may receive it. It has not been prepared in accordance with legal requirements designed to promote the independence of investment research and as such is considered to be a marketing communication. Although we are not specifically constrained from dealing ahead of our recommendations we do not seek to take advantage of them before they are provided to our clients.


.jpeg.98f0cfe51803b4af23bc6b06b29ba6ff.jpeg)


0 Comments
Recommended Comments
There are no comments to display.
Create an account or sign in to comment
You need to be a member in order to leave a comment
Create an account
Sign up for a new account in our community. It's easy!
Register a new accountSign in
Already have an account? Sign in here.
Sign In Now