Could European inflation diverge from the US?

Entry posted by ArvinIG in Analyst Article
655 views
UK inflation in focus as divergence with the US could highlight potential differences in monetary policy outlook.

Source: Bloomberg
UK inflation key to determining whether we will see Europe and US outlook diverge
The UK economy has come under intense scrutiny of late, with Friday’s GDP release highlighting the continued stagflation underway in the face of rising costs and negative growth.
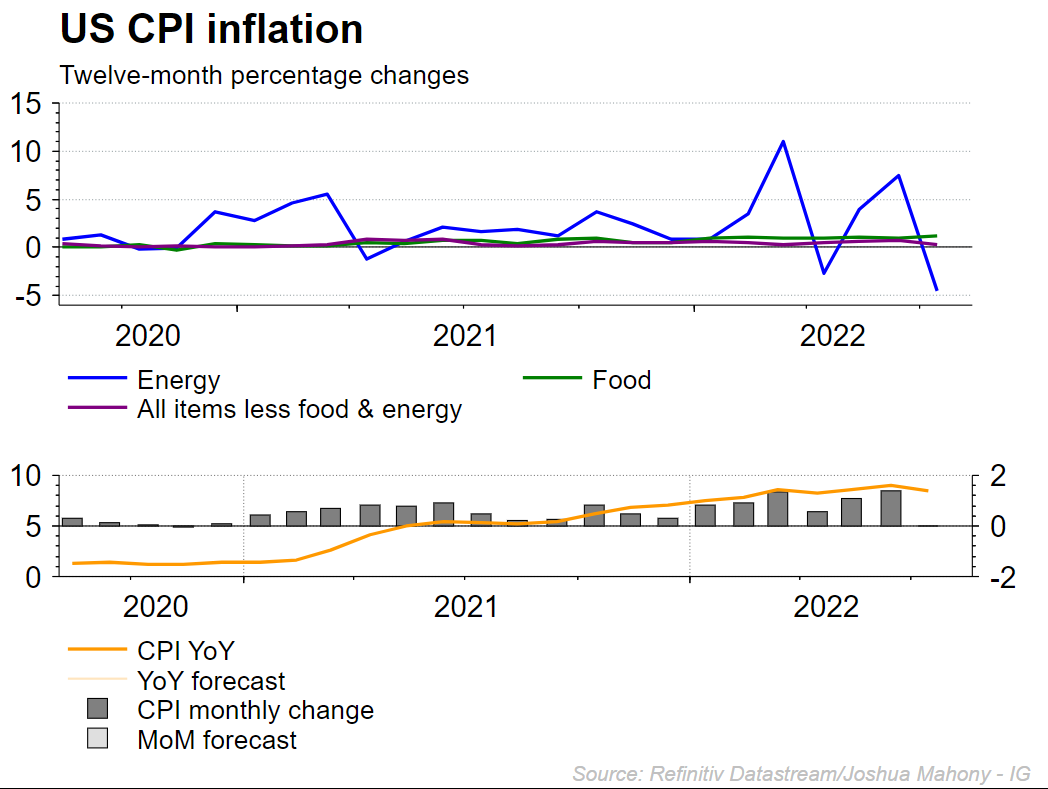
Last week managed to provide a bullish resurgence for stocks in the wake of US consumer price index (CPI) and PPI data, lifting optimism that inflation had topped out.
However, it is notable that the decline in US prices acme largely as a result of declining energy prices. For one thing, that raises questions over whether we will soon see energy prices rise again to dampen spirits amongst equity markets.
Source: Refinitiv
Nonetheless, while we have seen US inflation rise, the pertinent question for traders comes when considering the different dynamic between US and European energy prices. The breakdown in relations between the West and Russia brings heightened risk that those countries heavily reliant upon imports from Russia.
Baseload energy prices in Germany and France has been soaring as the restrictions of Russian gas are coupled with a whole host of other factors driving up prices. Elevated temperatures have been at the core of those alternate factors, with lower wind levels, and now a shrinking in the river Rhine which impacts coal transport and the ability to cool nuclear power plants.
That highlights how Europe certainly does appear at risk of seeing elevated prices despite the hope brought by declining US inflation last week. For the UK, we have seen prices grow at the fastest rate of the three, with Brexit restrictions on movement of goods and people serving to exacerbate the plethora of issues causing prices to rise elsewhere.
UK inflation in view
Wednesday brings the notable UK inflation reading, with markets expecting to see Year-on-Year (YoY) CPI inflation reach 9.9%. The Bank of England (BoE) predictions that inflation will top out at 13.3% in October provides the basis for further upside to come. Of course, the wider decline in crude prices does raise the possibility of a lower-than-expected reading like the US.
However, there is a chance that prices continue to rise, creating a wider gap between US and UK inflation. Such a move would inevitably cause markets to realign to adjust to any perceived shift in monetary trajectory.
Notably, the cheap energy being provided by Russia to Asian nations doe mean that there is significantly less pressure on the likes of Japan and China to raise rates. We have seen that through the surprise China rate cut this weekend.

Source: Refinitiv
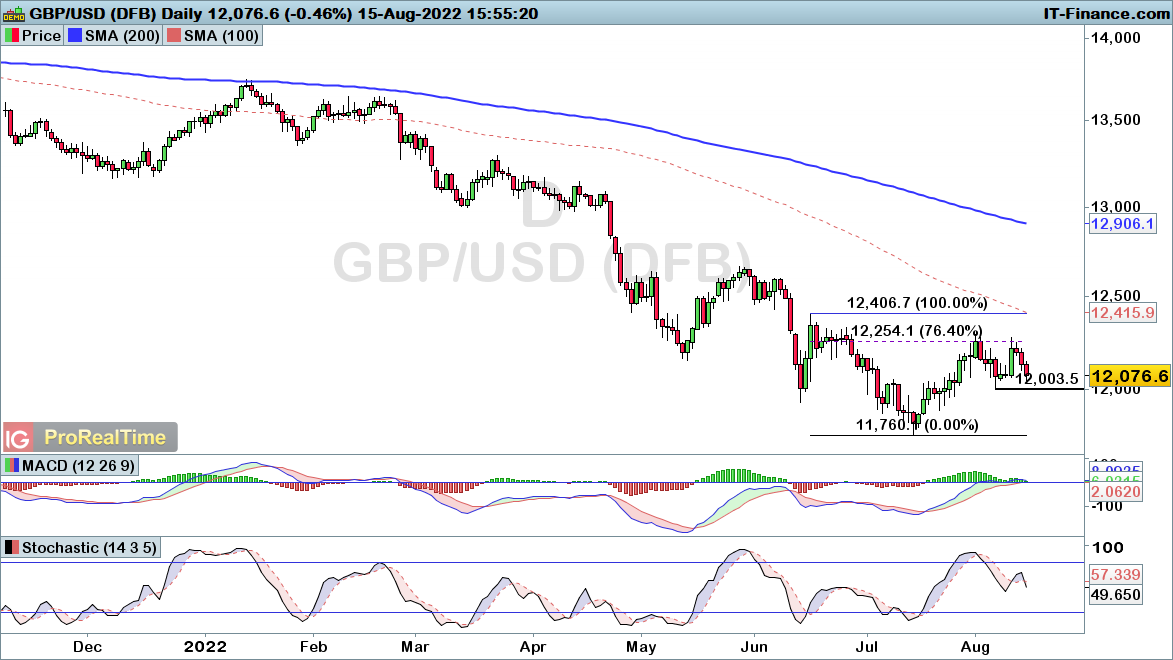
GBP/USD could turn higher if Federal Open Market Commitee-BoE outlook diverges
GBP/USD remains within a downward trend despite the gains seen over the course of the past July. Wednesday’s inflation gauge could help lift the pair if we do see a substantial upside move for UK inflation as expected. The ability to break up through 1.2406 will ultimately be key if this trend is to reverse.
However, it is also worthwhile noting that a bearish reversal for stocks would likely dampen sentiment around GBP/USD as traders head back into the dollar. Should GBP/USD strengthen, it would cause FTSE 100 underperformance given the fact that the majority of listed stocks earn revenues in foreign currencies.
Thus risk-on sentiment for stocks could drive GBP/USD higher, bringing FTSE outperformance. Meanwhile, a decline in markets would likely drive GBPUSD lower and bring relative outperformance for the FTSE 100 compared with other major markets.
Source: ProRealTime


.jpeg.98f0cfe51803b4af23bc6b06b29ba6ff.jpeg)


0 Comments
Recommended Comments
There are no comments to display.
Create an account or sign in to comment
You need to be a member in order to leave a comment
Create an account
Sign up for a new account in our community. It's easy!
Register a new accountSign in
Already have an account? Sign in here.
Sign In Now