EUR/USD and GBP/USD recover further from multi-decade lows while EUR/GBP stalls
EUR/USD and GBP/USD regain more of their recent losses while EUR/GBP looks to be capped.
EUR/USD probes resistance after last week’s 75-basis point ECB rate hike
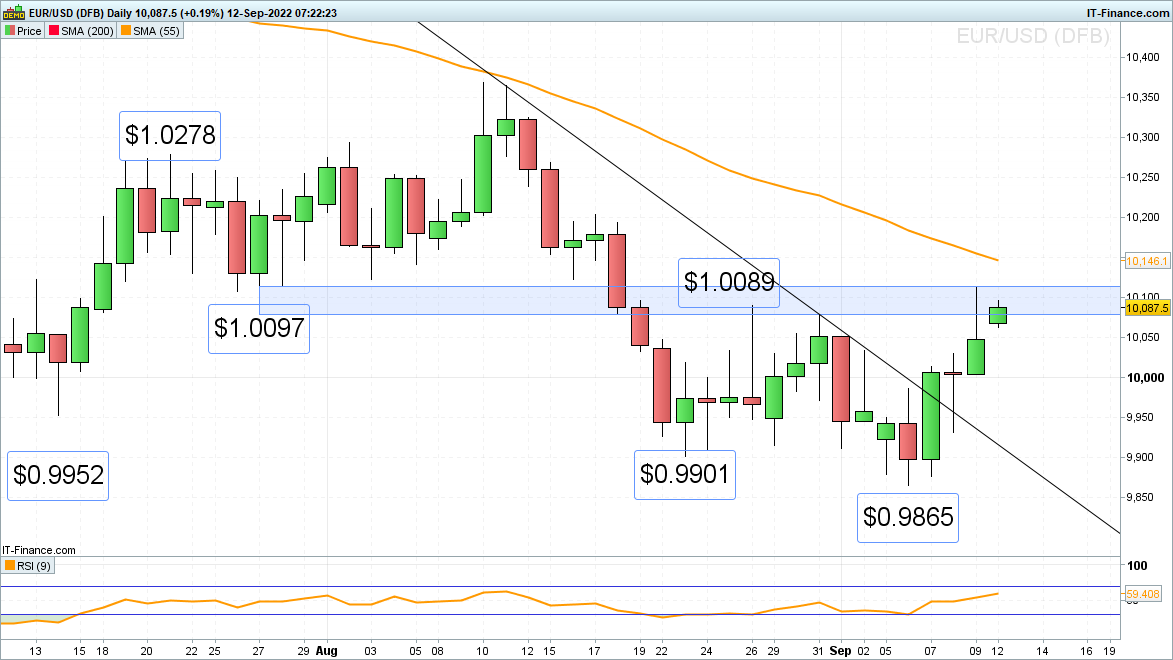
EUR/USD continues to flirt with its $1.0079 to $1.0097 late July low and late August highs following last week’s European Central Banks (ECB) unprecedented 75-basis point (bp) rate hike and Bundesbank President Joachim Nagel stating over the weekend that the ECB will need to continue raising interest rates if high inflation persists.
With policymakers pursuing a hawkish stance and reportedly prepared to deliver another massive 75bp rate hike in October, the Euro is likely to revisit last week’s high at $1.0113. If overcome, the 55-day simple moving average (SMA) at $1.0146 and perhaps the 17 August high $1.0203 may be reached next.
Minor support comes in around parity, a psychological level market participants keep an eye on.

Source: IT-Finance.com
EUR/GBP continues to flirt with the July peak
Last week EUR/GBP rallied to £0.8711, close to its June peak at £0.8721, following the ECB’s 75bp rate hike in September before consolidating. On Monday morning the cross continues to trade near the July and early September highs around £0.8677 while retaining a slightly bullish bias as UK gross domestic product (GDP) grows by a less than expected month-on-month (MoM) 0.2% in July, industrial production drops by -0.3% (versus an expected 0.4%) and manufacturing production comes in weaker than expected at 0.1% (instead of a forecast 0.3%).
While Thursday’s intraday low at £0.8655 underpins, an immediate upside bias should be maintained. A rise and daily chart close above the June peak at £0.8721 would mean a significant break out of a key resistance zone and would open the way for the £0.8797 early February 2021 high to be reached.
Were a reversal to the downside to unfold, though, and Thursday’s low at £0.8655 to give way, another interim top would likely be formed with the current September low at £0.8567 being back in the firing line. The fact that negative divergence can be spotted on the daily relative strength index (RSI) points to the toppish scenario remaining the more likely one.

Source: IT-Finance.com
GBP/USD recovers further from its 37-year low
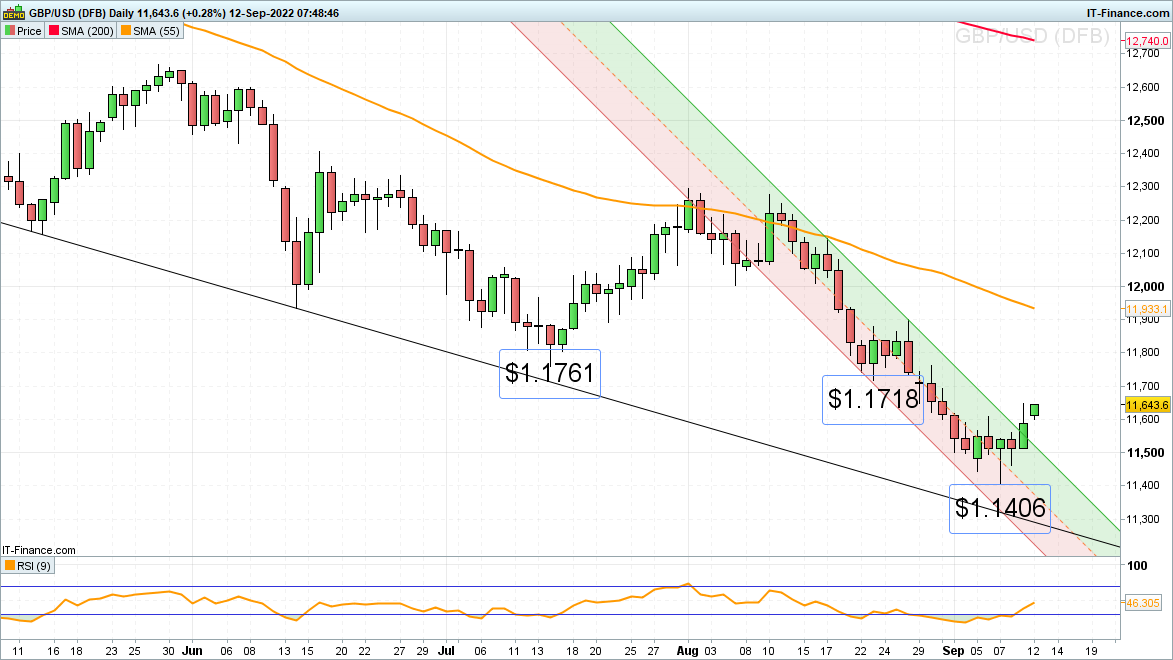
GBP/USD recovers further from last week’s $1.1406 low, a level last traded in 1985, amid a postponed Bank of England (BoE) meeting due to Her Majesty Queen Elizabeth II’s passing last week and a period of national mourning being adhered to in the UK. The next BoE meeting will now take place on Thursday the 22 of September instead of this Thursday.
With the UK showing its smallest trade shortfall since last December with its trade deficit narrowing to GBP 7.8 billion in July from GBP 11.4 billion in the previous month while imports of goods and services to the UK fell by 1.6% from a month earlier, GBP/USD continues to rise.
A minor bullish trend reversal is taking place with the July and 23 August lows at $1.1718 to $1.1761 being in focus. Potential slips below the 6 September high at $1.1609 should find support around the $1.15 mark which acted as support in early September.

Source: IT-Finance.com


0 Comments
Recommended Comments
There are no comments to display.
Create an account or sign in to comment
You need to be a member in order to leave a comment
Create an account
Sign up for a new account in our community. It's easy!
Register a new accountSign in
Already have an account? Sign in here.
Sign In Now