S&P 500’s June bottom continues to be tested: Brent crude, Straits Times Index, GBP/USD
Attempts to pare some losses in the latter half of the trading session were quickly overturned with a last-hour sell-off, as sellers remain bent on retesting the June 2022 bottom for both the S&P 500 and Nasdaq.
 Source: Bloomberg
Market Recap
Attempts to pare some losses in the latter half of the trading session were quickly overturned with a last-hour sell-off, as sellers remain bent on retesting the June 2022 bottom for both the S&P 500 and Nasdaq. For the Dow Jones Industrial Average (DJIA), it has officially joined the ranks of its counterparts after closing in the bear market territory overnight. With technical conditions and market breadth hitting oversold levels, some near-term relief may play out this week but that may be nothing more than a last-ditch effort to push back against bear market territory, as increased risks of recession may eventually leave economically-sensitive sectors susceptible to further weakness. Further surge in Treasury yields remains as headwinds for risk sentiments, with poor demand for two-year note auction labelled as the catalyst, along with a renewed sell-off in UK gilt on the conflicting government fiscal plans. Continued rise in US real yields remains an obstacle for equity markets by lowering the equity risk premium and until there is a clear sign of a reversal in place, the overall downward trend for indices seem to remain.
A series of comments from central bankers continues to reiterate the fight against inflation as the top priority, but the determination to do so at the expense of economic activities remains the cause for worry. This was the takeaway from speeches by European Central Bank (ECB) President Christine Lagarde, along with Federal Reserve (Fed) official Loretta Mester. Further comments from central banks are in the pipeline today such as well-known Fed’s hawk, James Bullard. The US consumer confidence data will also be on watch.
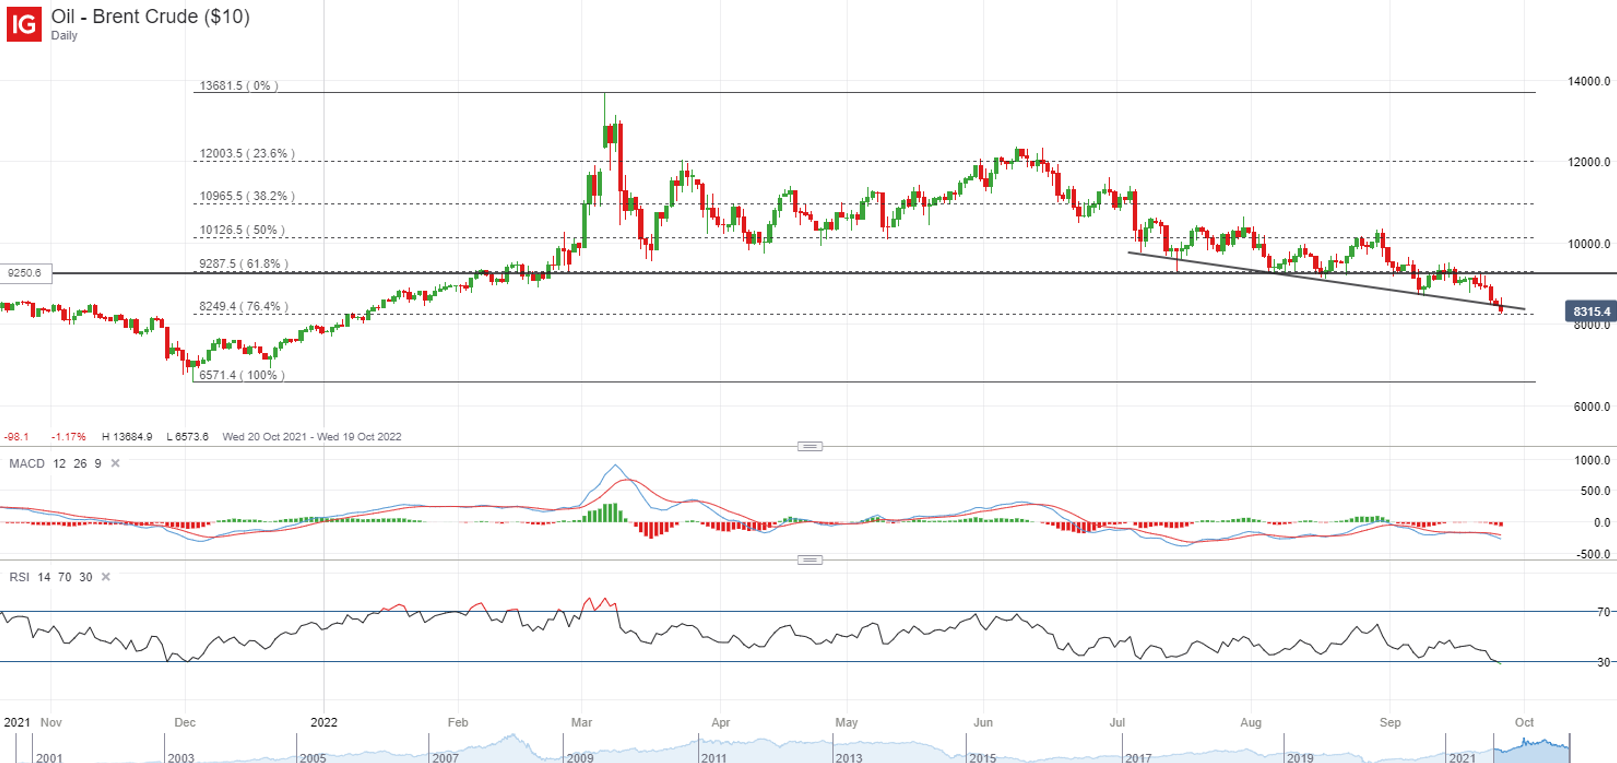
Higher risk of recession, along with a stronger US dollar, continue to weigh on Brent crude prices to start the new week. The formation of a new lower low reinforces its ongoing downward trend, as prices currently hang at a key 76.4% Fibonacci retracement level. A fall below the US$80 level could increase the pressure to follow up with further production cuts at the next Organization of the Petroleum Exporting Countries Plus (OPEC+) meeting on 5 October, which could drive a knee-jerk reaction in oil prices to the upside. But the realisation of ongoing production-target miss by OPEC+ members could still lead to some eventual shrugging-off and leaves recession risks in the driving seat for prices.
 Source: IG charts
Asia Open
Asian stocks look set for a mixed open, with Nikkei +0.41%, ASX +0.30% and KOSPI -0.64% at the time of writing. Resilience in the US dollar, along with a continued rise in yields, continue to drive a mixed response in the equity markets, although positive moves in the US equity futures this morning suggest an attempt to stabilise. This comes as a retest of the June bottom is in place for the S&P 500. With market recalibrating its expectations for a more aggressive global monetary tightening, Japan is placed under increasing scrutiny, with their 20-year government bond yield rising to 1.010% this morning, which is its highest since December 2015. While their accommodative policies may seem undeterred for now, with a 0.1% increase in short-term rate being priced at a mere 13% probability, the pressure seems on for the central bank to provide further reinforcement for its easy policy stance.
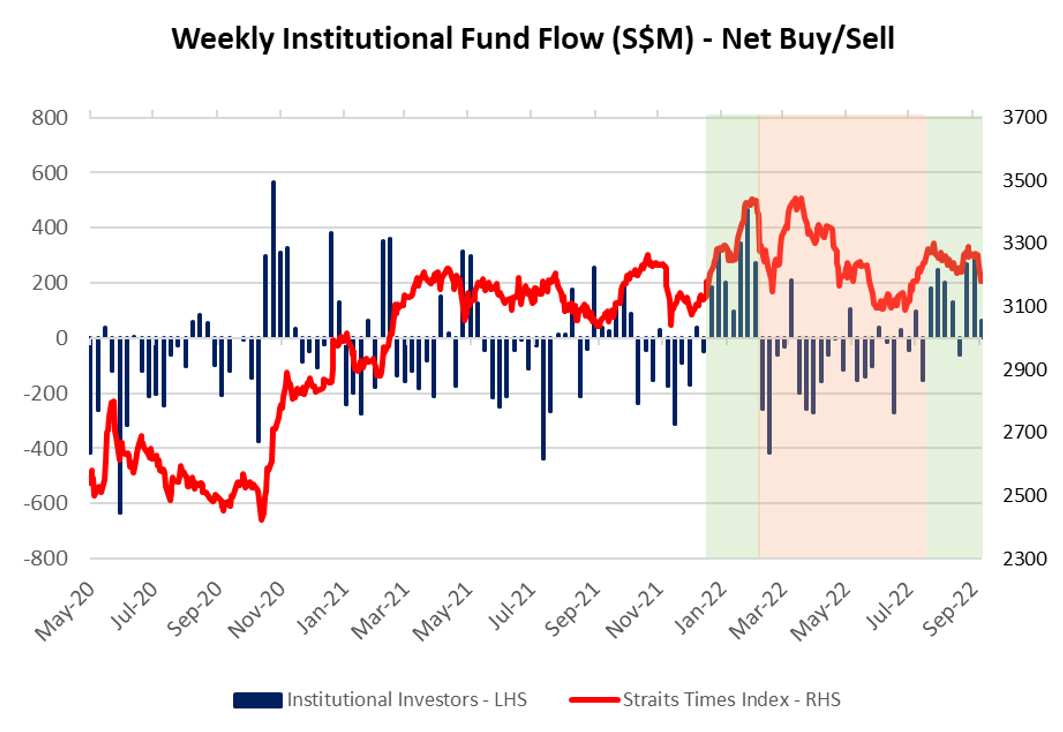
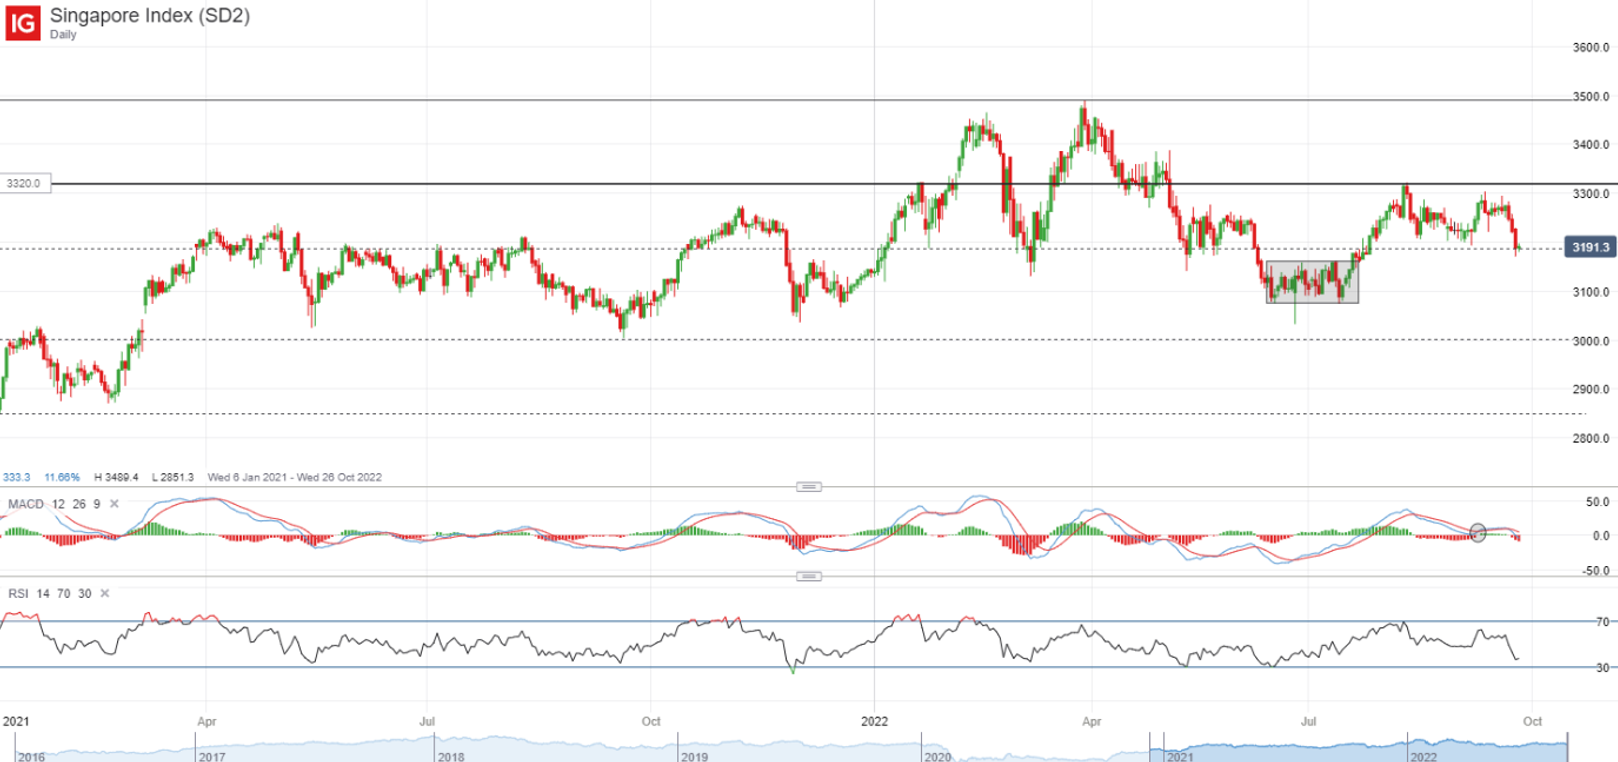
For the Straits Times Index (STI), past two months have revealed consistent net fund inflows from institutional investors, with the upward shift in interest rate expectations potentially drawing some traction back into the financial sector. This led to a largely-consolidating pattern for the index since August, as opposed to the clear downward move in the S&P 500. However, technicals suggest that its resilience seems to be coming under pressure as the index is on the verge of breaking below its 3,187 resistance-turned-support level. Further downside may leave the retest of its July bottom at the 3,100 level on watch over the longer term.
 Source: SGX, IG
 Source: IG charts
On the watchlist: Can GBP/USD find its footing after falling as much as 10% to start the week?
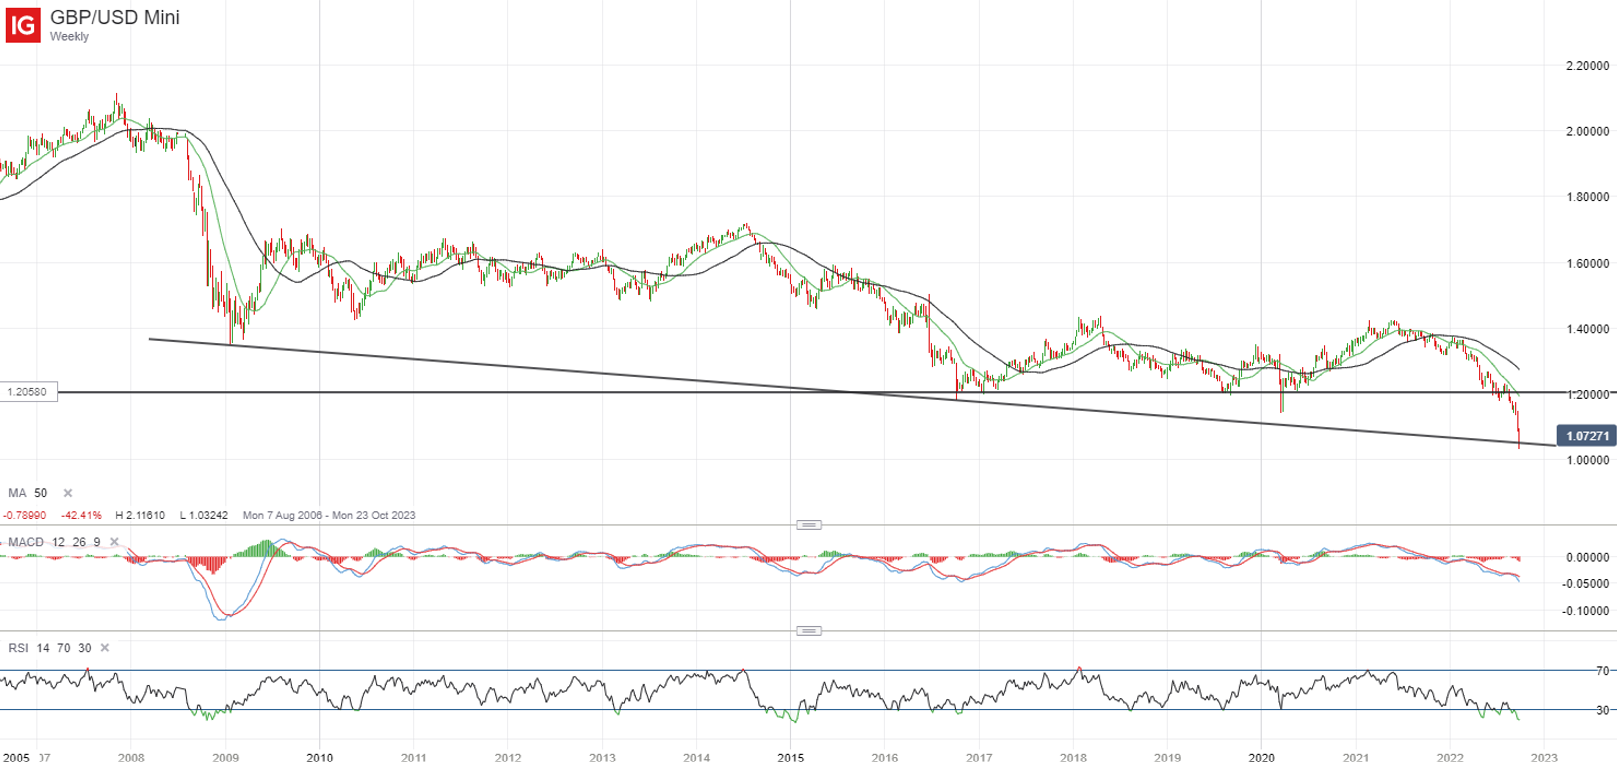
The conflict between fiscal and monetary policies in UK has bolstered hopes for an emergency inter-meeting hike by the Bank of England (BoE) to stabilise the sterling, but those expectations were met with some pushback when the central bank signalled its intention to wait until the November meeting for a response. That translates to more than a month of waiting, but nevertheless, the commitment laid out by BoE Governor Andrew Bailey to bring down inflation and ‘to monitor developments in financial markets very closely’ still leave the option of an off-cycle intervention open and places a floor on the GBP/USD. That may aid to stabilise the cable in the near term, with expectations anchored for 126 basis-point (bp) hike in the November meeting and trading at parity is looked upon as a likely level of intervention. While some paring of losses may potentially play out in the near-term as sentiments attempt to stabilise, the overall downward trend remains intact with ongoing upward bias in US dollar. That may leave any formation of a lower high on watch, potentially at the 1.095 level, and the scenario of an eventual drift towards parity remains on the table.
 Source: IG charts
Monday: DJIA -1.11%; S&P 500 -1.03%; Nasdaq -0.60%, DAX -0.46%, FTSE +0.03%


.jpeg.98f0cfe51803b4af23bc6b06b29ba6ff.jpeg)
0 Comments
Recommended Comments
There are no comments to display.
Create an account or sign in to comment
You need to be a member in order to leave a comment
Create an account
Sign up for a new account in our community. It's easy!
Register a new accountSign in
Already have an account? Sign in here.
Sign In Now