Earlier gains for major US indices failed to sustain: S&P 500, Hang Seng Index, Gold

Entry posted by MongiIG in Market News
852 views
Earlier gains for major US indices failed to hold overnight, as initial relief in US Treasury yields proved to be short-lived and continued to tick higher.
 Source: Bloomberg
Market Recap
Earlier gains for major US indices failed to hold overnight, as initial relief in US Treasury yields proved to be short-lived and continued to tick higher. The US 10-year yield heading towards the 4% mark has been the chatter among market participants and an eventual move above 4% seems like a likely scenario, with the Federal Reserve (Fed) retaining its resolve to continue with tighter financial conditions and more talks of 5% rate surfacing from Fed officials as shown in the recent dot plot. These could present continued headwind for equities as further front-loading of hikes remains the narrative.
Overnight market sentiments reacted to the downside on comments from Fed official, James Bullard. Being known as one of the more hawkish Fed member, he continued to reiterate a further push into restrictive territory to ‘the 4.5% range’ to retain the Fed’s credibility to tame inflation and that rates need to stay higher for ‘some time’. The higher-for-longer stance has been constantly brought up before, but nevertheless it provides a catalyst for equity bears to tap on to challenge the June bottom.
Economic data continued to show some signs of resilience, with core capital goods orders increasing more than expected in August while consumer confidence came in higher at 108, compared to the 104.5 consensus. The S&P/Case-Shiller Home Price also showed home prices cooling at its fastest rate to 16.1% from the previous 18.7%. While this may provide hopes for falling rent prices (and hence consumer prices), the relationship may come with a lag of around 12-18 months. Until then, the Fed could continue to retain its tighter policies as inflation still carry the upside risks of being persistent over the coming months.
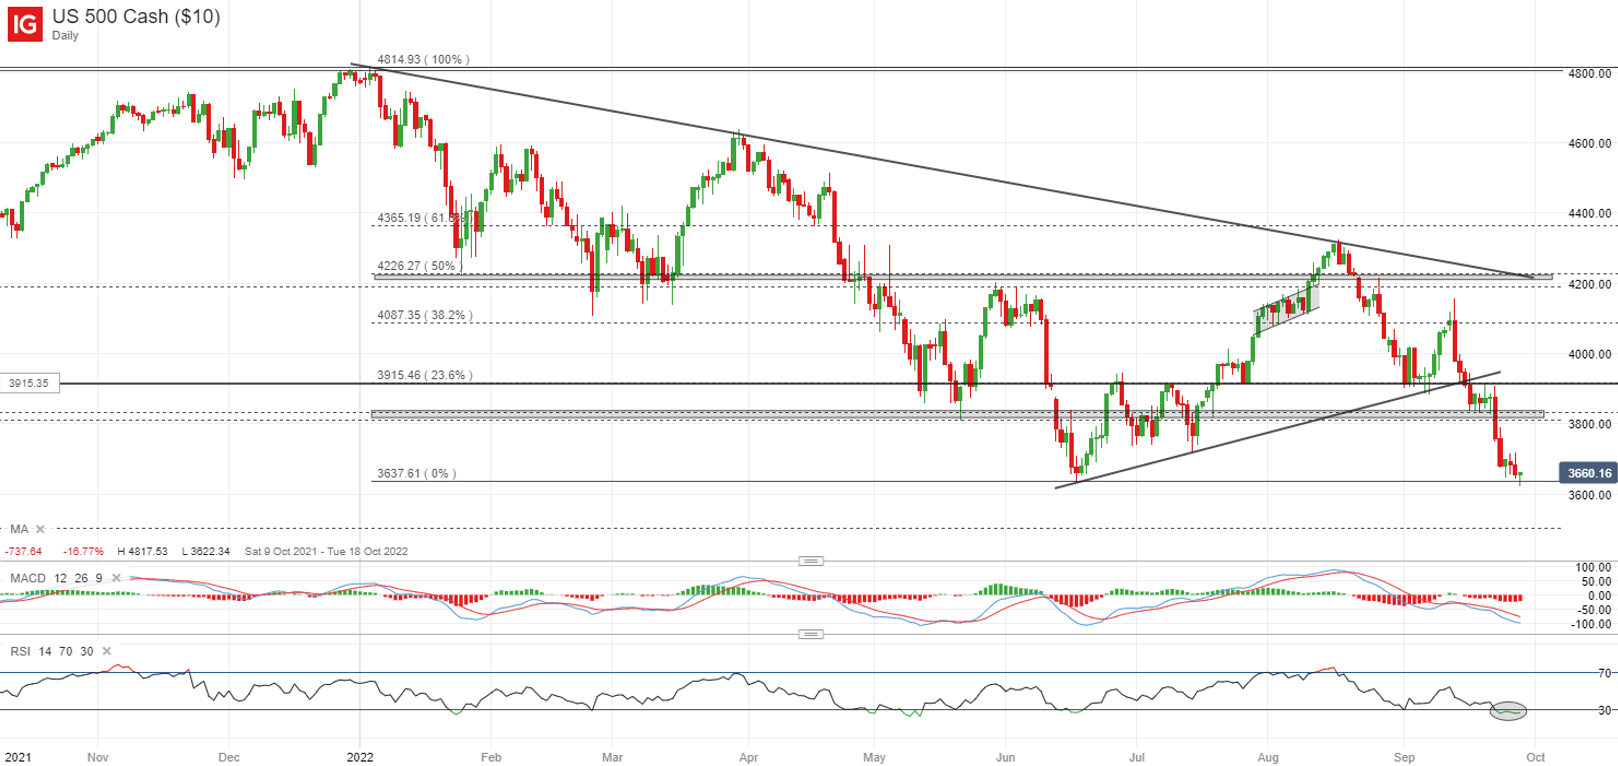
The S&P 500 continued to struggle with defending its June bottom, as previous efforts of dip-buying have been quickly overcome thus far. US equity futures this morning continued to reveal another attempt for a relief rally, tapping on oversold market breath and technical conditions for some near-term moderation as compared to a clear fundamental catalyst in my view. A close below the 3,640 level may leave the 3,500 level on watch next, where a 50% Fibonacci retracement level stands from its Covid-19 bottom to its January peak.
 Source: IG charts
Asia Open
Asian stocks look set for a mixed open, with Nikkei -0.46%, ASX +0.21% and KOSPI -0.75% at the time of writing. The ongoing market adjustment for a more aggressive Fed’s policy outlook continues to weigh on the region, particularly the tech-focused indices (Nikkei, KOSPI, Hang Seng as well). A more muted session may follow after Wall Street’s lacklustre close, with some focus on Australia’s retail sales figure.
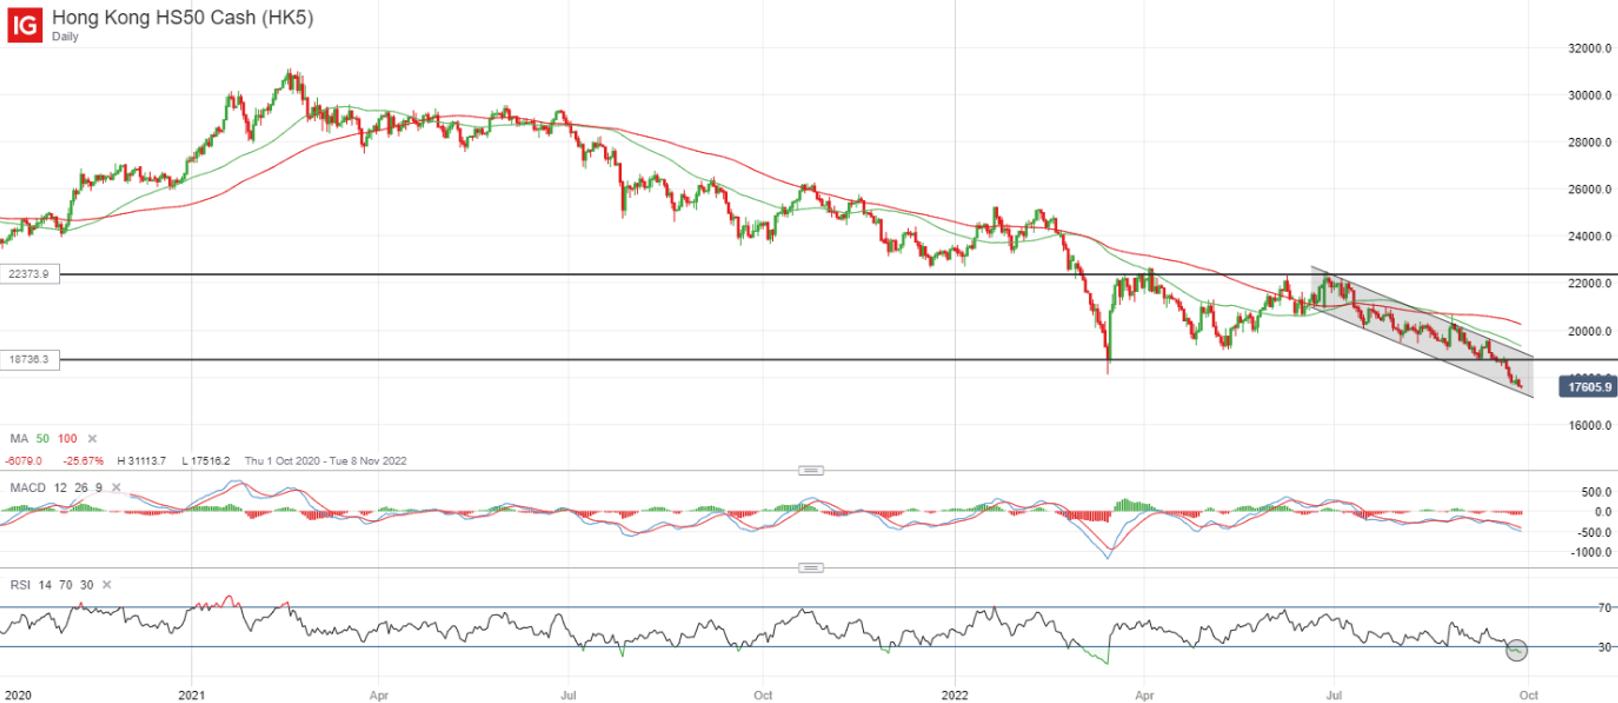
The Hang Seng Index (HSI) continues to trade within a descending channel pattern since June this year, with the formation of a new lower low reinforcing its overall downward trend. Previous key support at the 18,700 level has given way, where it marks a previous round of dip-buying when authorities ramp up its calls for supportive measures to lift the economy. Six months on, it seems that economic conditions have not improved much with China’s ongoing struggle with its zero-Covid policy, which may lead market sentiments to be less reactive to policy support now, but rather, seeking conviction in evidence of a more sustained economic recovery. Its shift towards a more tech-focused weighting also leaves it susceptible to greater weakness as conditions struggle with an aggressive rising interest rate up-cycle, which drives growth stocks’ underperformance. Its relative strength index (RSI) in oversold territory may support a near-term rally in the near term, but trading within the descending channel will leave the formation of a lower high on watch at the 18,700 level, in coincidence with its previous dip-buying level which will now serve as resistance.
 Source: IG charts
On the watchlist: Gold prices retain its downward bias after breaking below key support
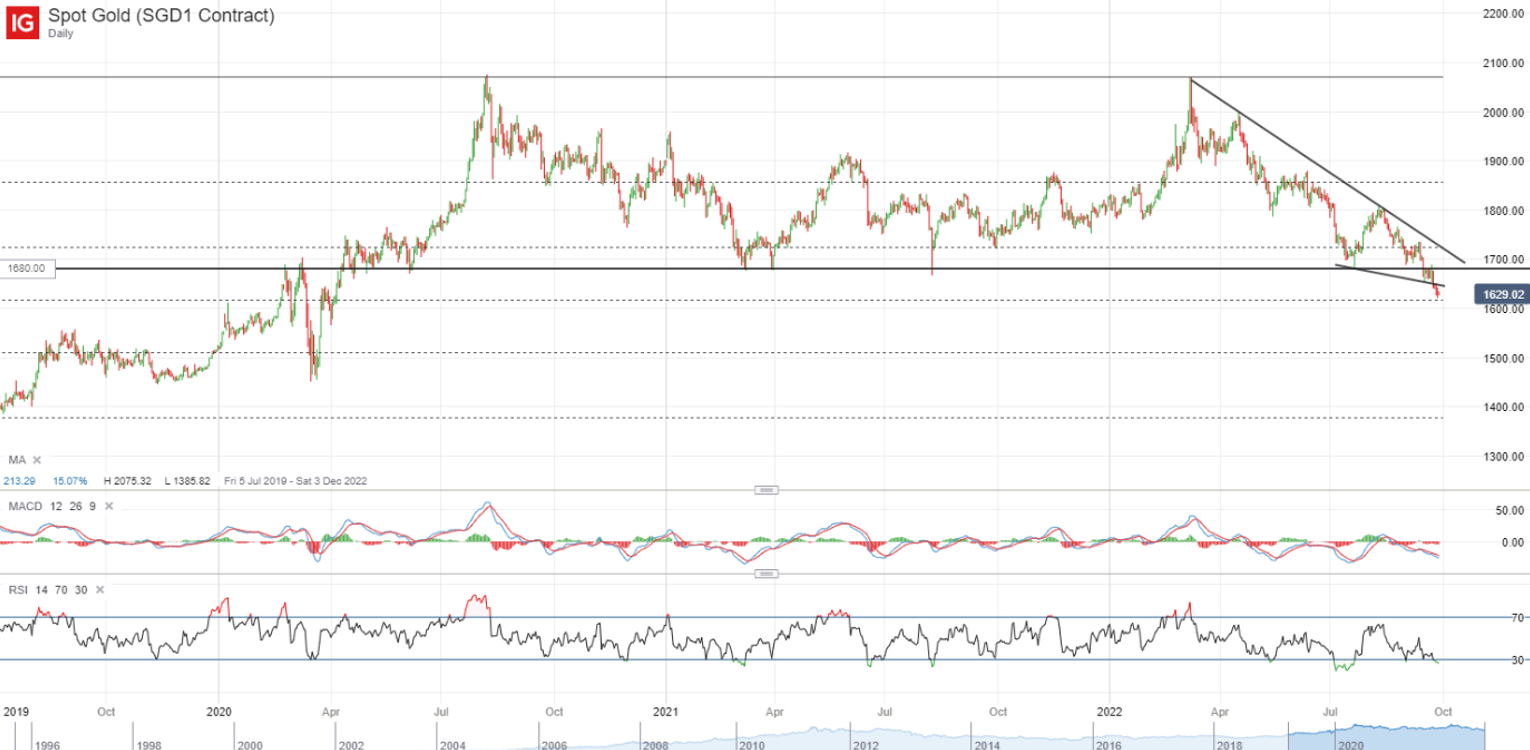
An ongoing uptick in US real yields overnight continued to weigh on non-yielding gold, as earlier gains were pared back, along with headwind from a stronger US dollar. It could seem that the overall downward trend for gold remains intact until we are able to see a dovish policy shift from the Fed or indications of pricing pressures posing less of a problem (potential moderation towards the 5% range), which both do not seem to be on the table yet. The latest Commodity Futures Trading Commission (CFTC) data revealed a lack of traction among money managers with their overall net positioning last week are at its lowest level since 2019. A downward break and a failed retest of the key US$1,680 support brings testament to the presence of strong sellers. While its RSI in oversold territory may aid to support some near-term relief, the lack of a fundamental tailwind for now may suggest that the downward bias remain, with one to watch for any formation of a lower high for another move lower. The US$1,680 will be a key support-turned-resistance to overcome, while a break lower of the US$1,618 level may potentially draw further downside to the US$1,530 level next.
 Source: IG charts
Tuesday: DJIA -0.43%; S&P 500 -0.21%; Nasdaq +0.25%, DAX -0.72%, FTSE -0.52%


.jpeg.98f0cfe51803b4af23bc6b06b29ba6ff.jpeg)


0 Comments
Recommended Comments
There are no comments to display.
Create an account or sign in to comment
You need to be a member in order to leave a comment
Create an account
Sign up for a new account in our community. It's easy!
Register a new accountSign in
Already have an account? Sign in here.
Sign In Now