Divergent monetary policy path could bring AUD/NZD reversal

Entry posted by MongiIG in Market News
405 views
AUD/NZD has reversed its risk correlation after the RBA rate hike, but will this mark the beginning of a wider turnaround for the pair?
 Source: Bloomberg
AUD/NZD tanks after protracted 2022 surge
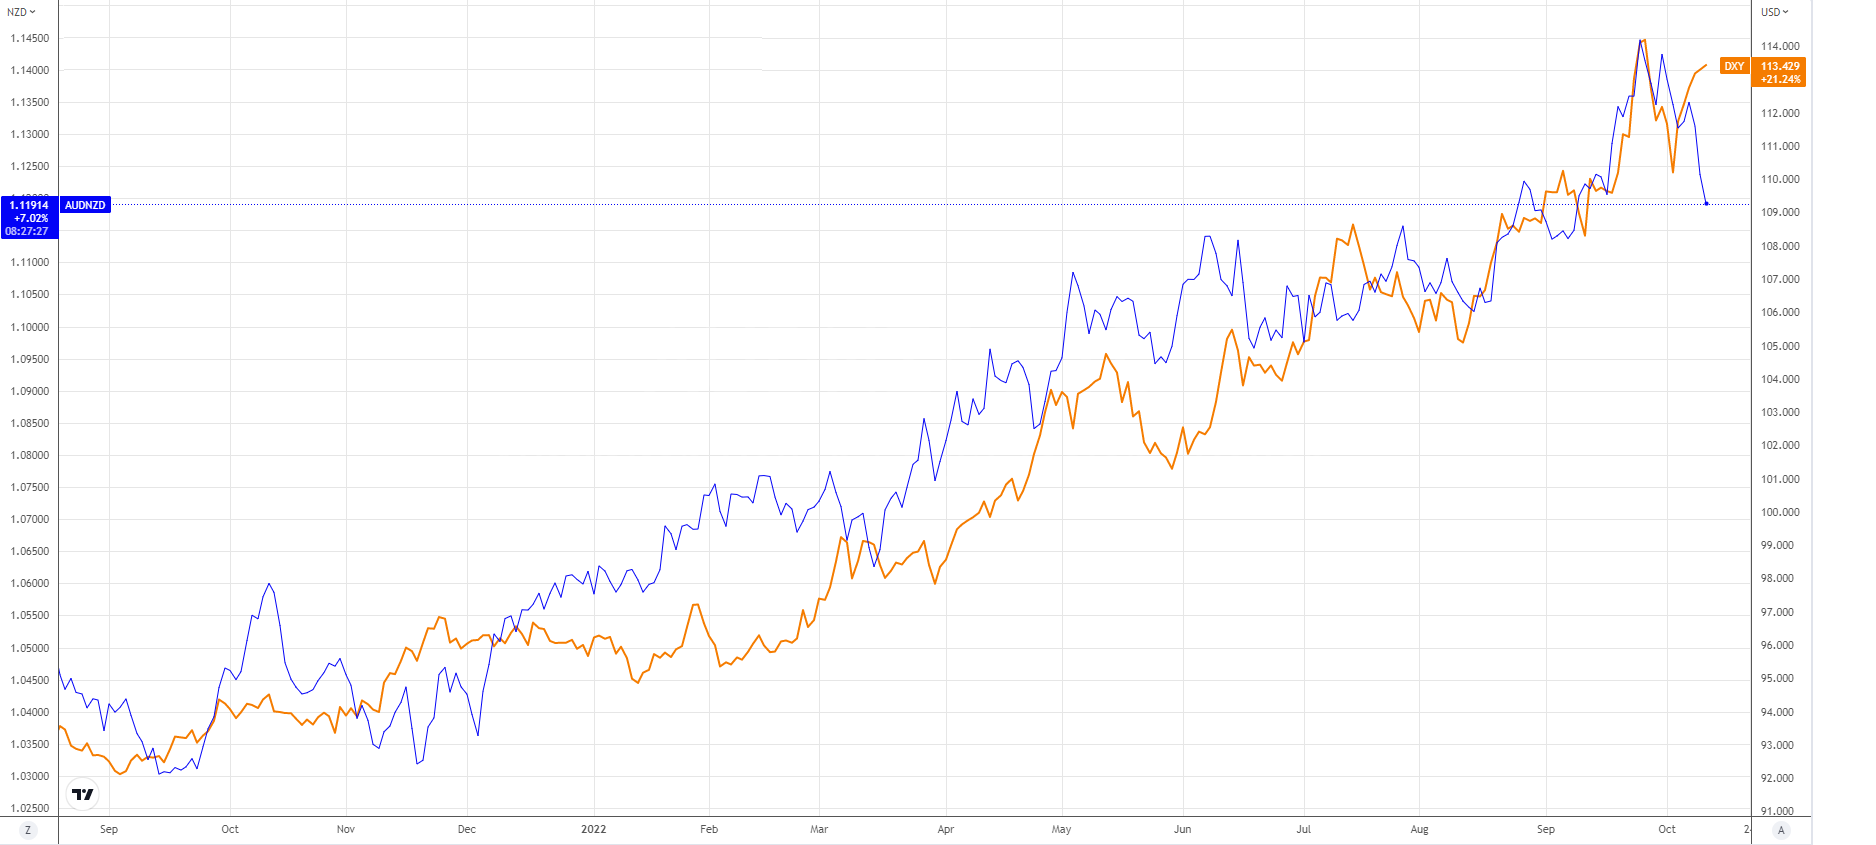
AUD/NZD has been a remarkably reliable pair over the course of this year, with eight of the past nine months bringing positive gains. Despite the losses seen this month, the pair remains 7% higher than where it started the year. In part that has come thanks to a high correlation between AUD/NZD and the dollar, with risk-off sentiment favouring the Australian dollar over the New Zealand dollar. That can be seen below, with AUD/NZD rising alongside the dollar index over the course of this year. That appears to have changed this month, with the continued strength of the greenback coming in stark contrast to the collapse in AUD/NZD. This comes off the back of a 25-basis point rate hike from the RBA which signalled an early attempt to slow the pace of tightening.
 Source: TradingView
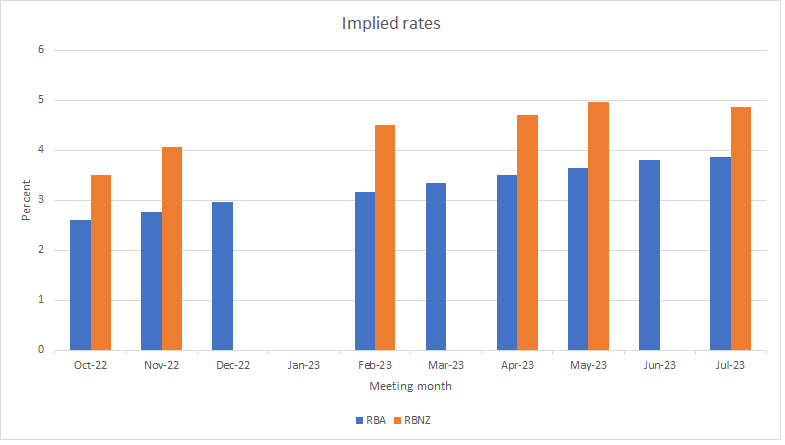
The fact that the RBA has started to slow the pace of monetary tightening is notable as it highlights the widening pathway for these two countries. Below we can see the implied rates for each meeting. An example of the shift in outlook comes by noting that while RBNZ rates are expected to be around 5% in mid-2023, the RBA implied rate points to a figure around 3.6% at that point. This widening of the tightening process should benefit the New Zealand dollar, as we have seen this month.
 Source: Eikon
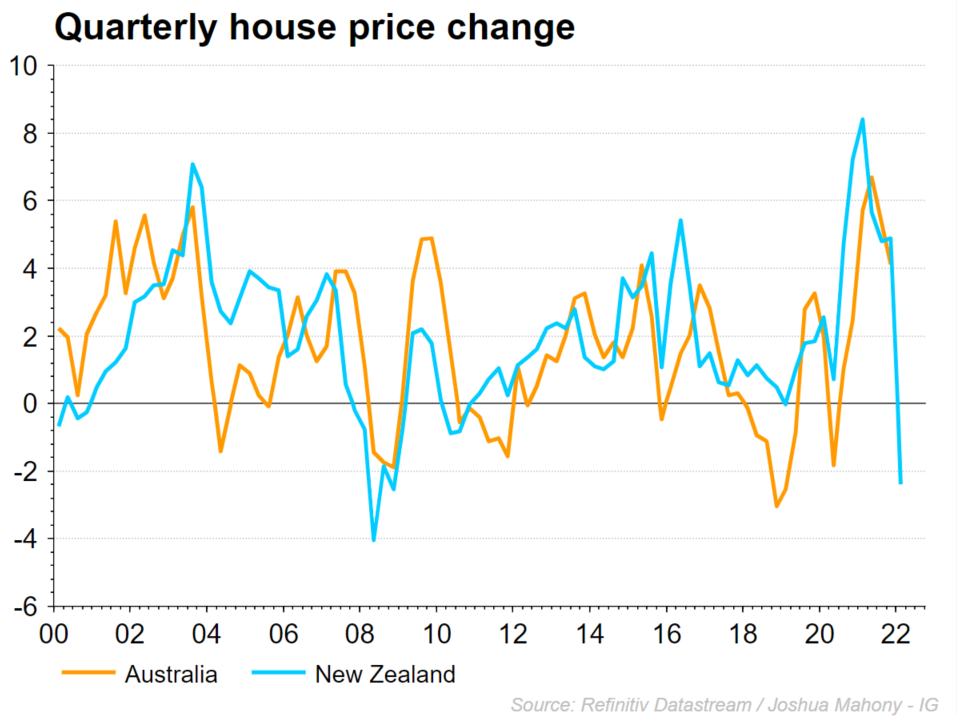
Looking at house price movement over the past quarter, we can see that elevated interest rates could bring a major correction after an impressive Covid surge in prices. New Zealand is leading the way here, but short-term city pricing does signal the potential for a similar move in the Australian figure.
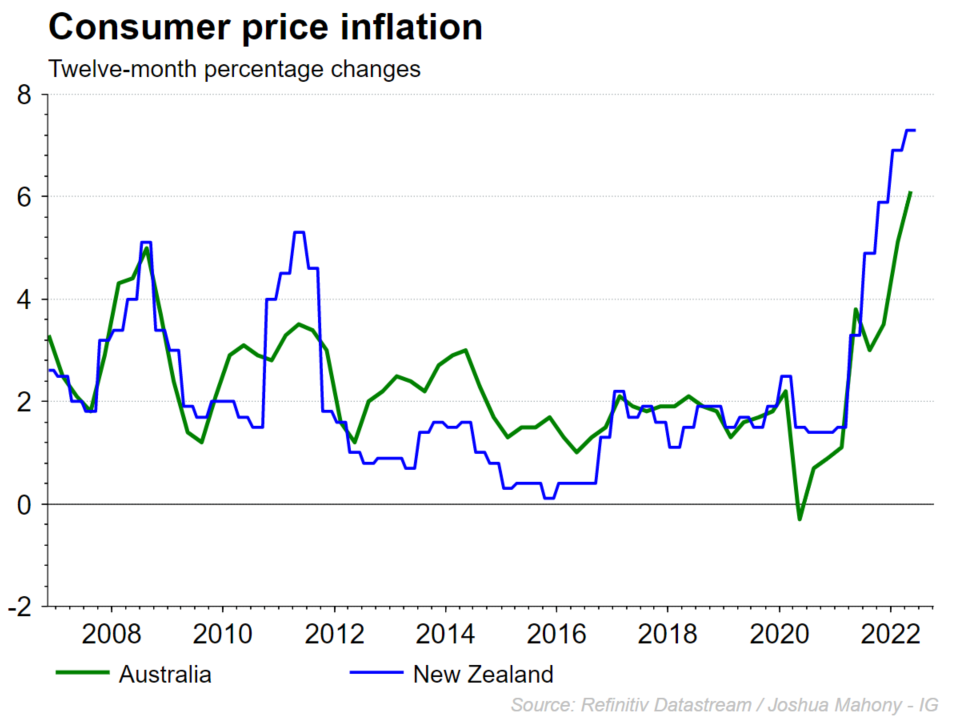
From an inflation perspective, we can also see how New Zealand also has a bigger problem when it comes to prices of late. Nonetheless, until we hear the RBNZ change their approach to limit market expectations, there is a good chance we see interest rates widen and AUD/NZD reverse.
Technical analysis
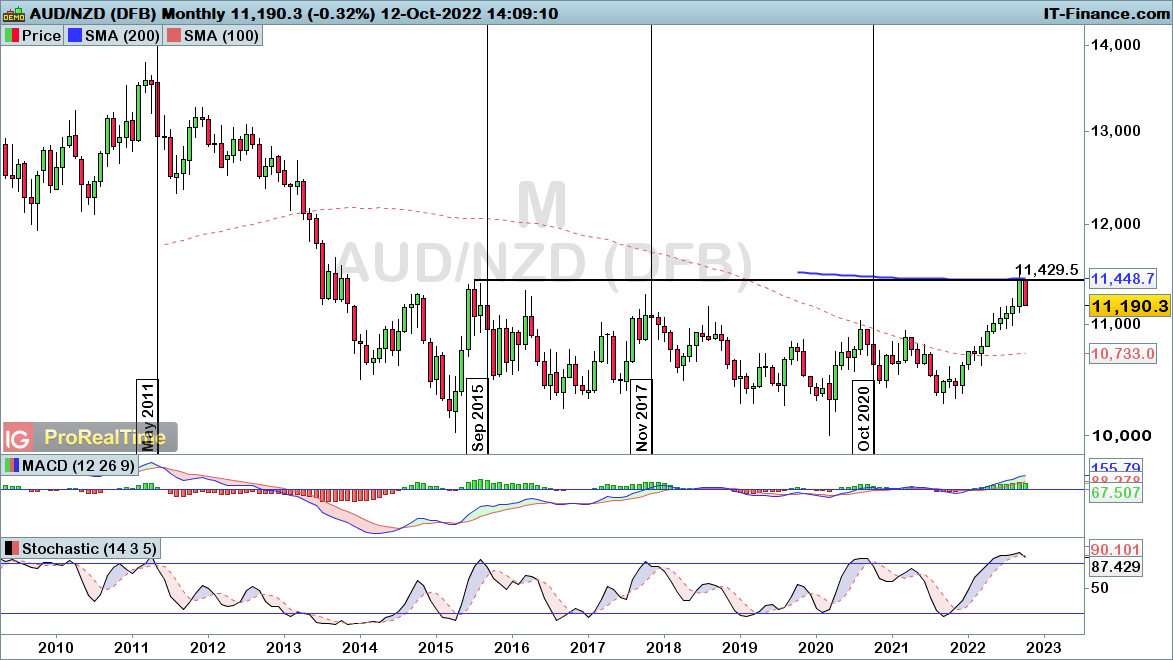
Looking at the monthly chart, we can see price has tumbled from the confluence of the 2015 high and 200-SMA around 1.1429. This brings a heightened chance of a bearish engulfing reversal pattern. With the stochastic also rolling over within overbought territory, we could yet see a bearish sell signal if the line crosses below the 80 threshold.
 Source: ProRealTime
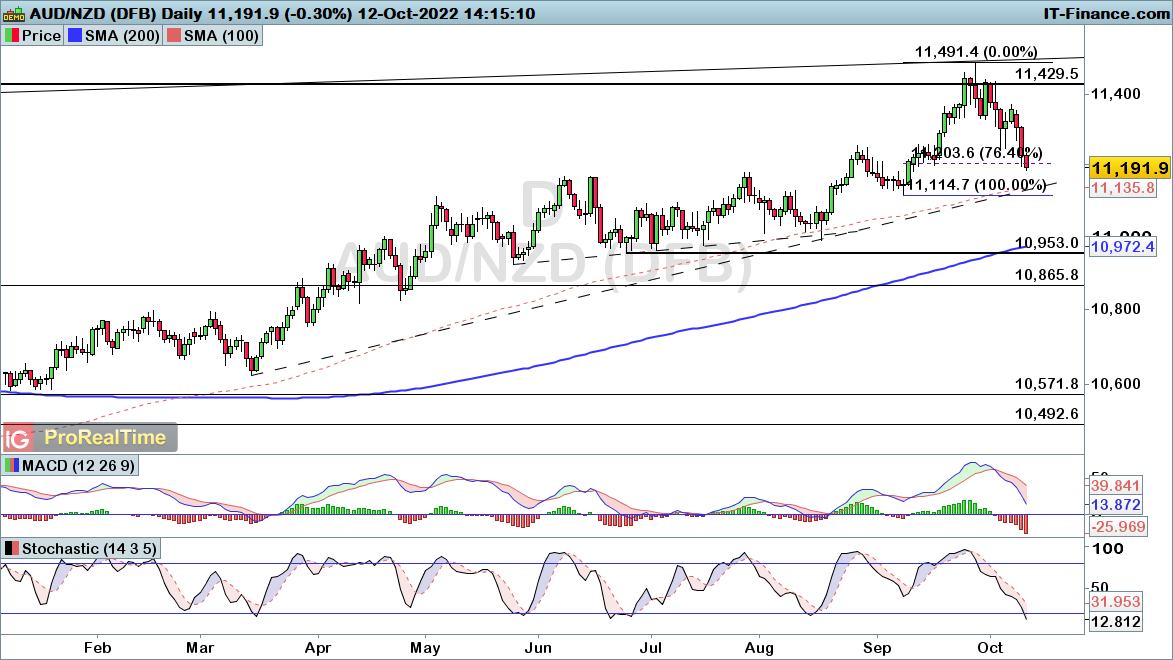
The daily chart brings greater clarity over just how this is playing out, with price still remaining within a bullish pattern for now. That trend of higher lows would end with a break below the 1.1114 level. Coincidentally, such a break would also bring a move through trendline and 100-SMA support. As such, keep a close eye out for a potential major reversal in play should price fall below 1.1114. Until that level gives way, the bullish trend does remain in play.
 Source: ProRealTime

.jpeg.98f0cfe51803b4af23bc6b06b29ba6ff.jpeg)
.jpeg.573e1479f76cb6c02faab8d9bd670ff8.jpeg)

0 Comments
Recommended Comments
There are no comments to display.
Create an account or sign in to comment
You need to be a member in order to leave a comment
Create an account
Sign up for a new account in our community. It's easy!
Register a new accountSign in
Already have an account? Sign in here.
Sign In Now