American Airlines Group Inc’s share price and Q3 earnings results preview

Entry posted by MongiIG in Market News
601 views
What to expect and how to trade American Airlines upcoming results from a fundamental and technical perspective.
 Source: Bloomberg
When are the American Airlines Group’s results expected?
American Airlines Group Inc is set to release its third quarter (Q3) 2022 results on 20 October 2022. The results are for the fiscal quarter ending September 2022.
What is ‘The Street’s’ expectation for the Q3 2022 results?
‘The Street’ expectations for the upcoming results are as follows:
Revenue of $13.265 billion : +47.90% year on year (YoY)
Earnings per share (EPS): $0.47 (>100% YoY)
The American Airlines share price managed to stabilise above its near two-year early October low after raising its quarterly sales expectation earlier this week.
The first of the four largest US airlines to publish its Q3 earnings, American Airlines now sees sales up 13% from the same period in 2019 and expects to post third-quarter sales above prior guidance. Pre-tax margin is expected to come in at 4.5%, above the airline’s guidance for up to 4%.
It is the latest positive sign for the aviation industry which is witnessing an ongoing recovery in business class trips and comes after a number of US carriers were surprised by the strength of post-Labor Day leisure travel.
The carrier also averted a pay strike by more than 50 of its aircraft maintenance technicians and crew chiefs at London’s Heathrow airport on Tuesday after agreeing a 19% pay deal with Unite, UK’s leading union.
How to trade American Airlines into the results
 Source: Refinitiv
Reuters Refinitiv data shows a consensus analyst rating of ‘hold’ for American Airlines – 1 strong buy, 1 buy, 14 hold, 2 sell and 1 strong sell - with the median of estimates suggesting a long-term price target of $14.25 for the share, roughly 16% higher than the current price (as of 12 October 2022).
 Source: IG
IG sentiment data shows that 96% of clients with open positions on the share (as of 12 October 2022) expect the price to rise over the near term, while 4% of these clients expect the price to fall whereas trading activity over the last week and month showed 59% of sells.
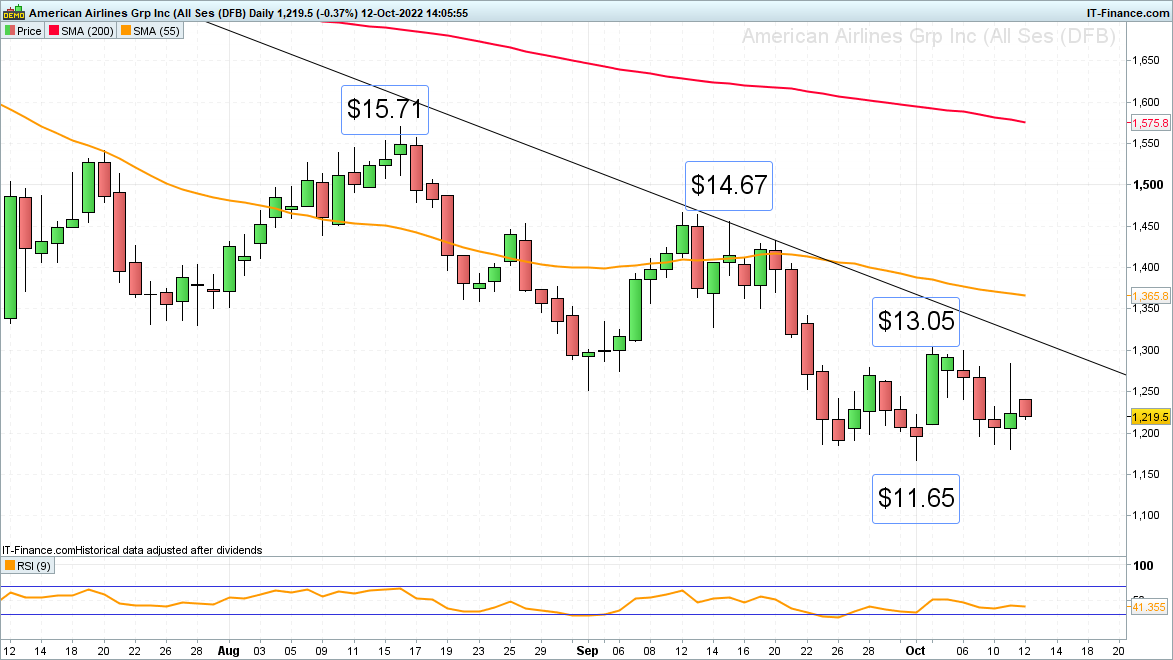
American Airlines – technical view
 Source: ProRealTime
The American Airlines share price has dropped by over 34% year-to-date with it recently trading at levels last seen in November 2020 and heading down towards the $11.22 to $10.63 technical support zone which consists of the August-to-October 2020 lows. So far, the carrier’s share price seems to be stabilising above its $11.65 early October low.
Should it be slipped through, a drop through the psychological $10 mark looks likely with the May 2020 low at $8.25 being in the frame as well.
Since the American Airline’s share price has been sliding since its $26.09 May peak, by so far close to 55%, and since a series of lower highs and lows can be spotted on the daily chart since August – the definition of a downtrend –, further downside may be seen. This will technically speaking remain the case while no rise and daily chart close above the August high at $15.71 unfolds.
For a short-term bullish reversal to become possible, a rise and daily chart close above not only the early October high at $13.05 but also above the May-to-October downtrend line at $13.22 would need to ensue. Only then could the September high at $14.67 be back in sight, a rise above which would be needed for a bullish trend reversal to gain traction.
 Source: ProRealTime
Summary
American Airlines is set to release Q3 2022 results on 20 October 2022
Q3 2022 results are expected to show a near 48% YoY increase in revenue as well as an over 100% increase in EPS
Revenue is expected to be boosted by stronger leisure and especially business class demand
Long-term broker consensus suggests the share to currently be a ‘hold’, with a median price target of $14.25
96% of IG’s clients with open positions are long the share but trading activity over the last week and month showed 59% of sells
The American Airlines share price has been falling since April and year-to-date trades down 34% with the $11.22 to $10.63 support zone representing its next potential downside target zone. The share would need to see a bullish reversal and daily chart close above the August high at $14.67 to begin forming a longer-term bullish reversal pattern


.jpg.27c55ea07d5a17683fbdbda06b8fcace.jpg)
0 Comments
Recommended Comments
There are no comments to display.
Create an account or sign in to comment
You need to be a member in order to leave a comment
Create an account
Sign up for a new account in our community. It's easy!
Register a new accountSign in
Already have an account? Sign in here.
Sign In Now