Higher yields weigh on rate-sensitive US tech: Gold, Singapore Blue Chip, GBP/USD

Entry posted by MongiIG in Market News
1,247 views
A recalibration of market expectations for a more hawkish Fed post-meeting translated to a fourth consecutive day of decline for US indices, as Treasury yields continued its way higher and uplifted the US dollar.
 Source: Bloomberg
Market Recap
A recalibration of market expectations for a more hawkish Federal Reserve (Fed) post-meeting translated to a fourth consecutive day of decline for US indices, as Treasury yields continued its way higher and uplifted the US dollar. The US two-year Treasury yields, which is most sensitive to shift in interest rate expectations, broke to a new 15-year high while the US 10-year yields headed to its one-week high as well. Higher yields meant greater downward pressure for rate-sensitive growth stocks, as underperformance in US big tech dragged indices lower on their heavy weightings.
Economic data overnight provided a mixed view for economic conditions. While the US ISM non-manufacturing Purchasing Managers' Index (PMI) fell short of expectations (54.4 versus 55.5 consensus) and showed a clear moderation in business activities and new orders, input prices paid by the service industries expanded at a faster pace from September. The employment index fell into contraction territory (49.1), but the relief was dampened when viewed with the upward revision in the labour reading for US manufacturing PMI last week. Greater clarity will be presented in the upcoming US non-farm payroll release today. Current expectations are pointing to job additions of 200,000 for October, with an uptick in unemployment rate to 3.6%, while wage growth to moderate to 4.7% year-on-year (YoY) from the previous 5%. Signs of a softer-than-expected labour market will be what equity bulls need to fuel a near-term recovery, although coming after the hawkish build-up from the Fed, it may take unemployment rate above the 4% mark to rekindle any talks of a ‘dovish pivot’ once more.
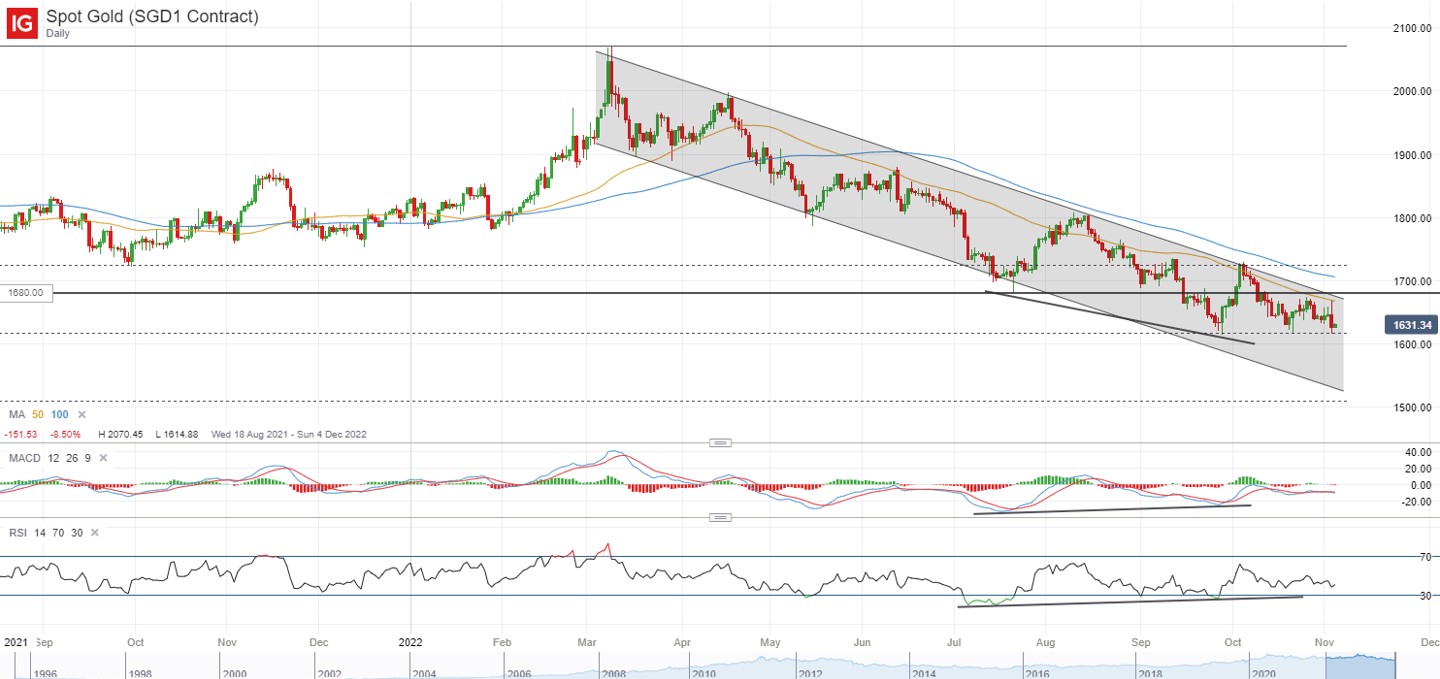
The continued shift in landscape towards a higher-for-longer interest rate drove a lack of traction for the non-yielding gold. With terminal rate expected to head towards the 5.25%-5.50% range by quarter two (Q2) next year, the opportunity cost for holding gold remains high. On the technical front, prices have been trading within a descending channel pattern, with recent hawkish takeaway from the Fed driving a retest of its September and October bottoms. Further downward bias remain, with a break below the US$1,618 level potentially paving the way towards the US$1,540 level next.
 Source: IG charts
Asia Open
Asian stocks look set for a largely negative open, with Nikkei -1.68%, ASX -0.11% and KOSPI +0.03% at the time of writing. The underperformance in Nikkei is due to the catch-up performance after its holiday break yesterday, while other indices are largely on some wait-and-see in the lead-up to the key US job report release later today.
Some resilience was presented in Chinese equities overnight, with the Nasdaq Golden Dragon China Index closing 3.2% higher at its one-week high. That said, the overall downward trend remains intact. The lack of a concrete catalyst for now (other than unconfirmed reopening rumours) could suggest recent upward move as more of a reversion from oversold technical conditions and extreme bearish sentiments, rather than clear signs that the worst is over. Yesterday, China’s Caixin composite and services PMI continued to head deeper into contraction territory, reflecting the impact from the Covid-19 outbreak. Recent uptick in Covid-19 cases to its highest in three weeks suggests that the risks of further virus restrictions as a trade-off for economic growth remains.
Closer to home, the Singapore Blue Chip Index has been trading within a falling wedge pattern since February this year, with recent move finding resistance at a key 76.4% Fibonacci retracement level, in coincidence with its 50-day moving average (MA). The downward trend continues to be presented with the formation of lower highs and lower lows thus far. Trading within the wedge pattern may leave the 260.00 level in sight over the longer-term term, where the lower wedge trendline support resides.
 Source: IG charts
On the watchlist: Recession outlook pulled GBP/USD lower despite a 75 bp hike
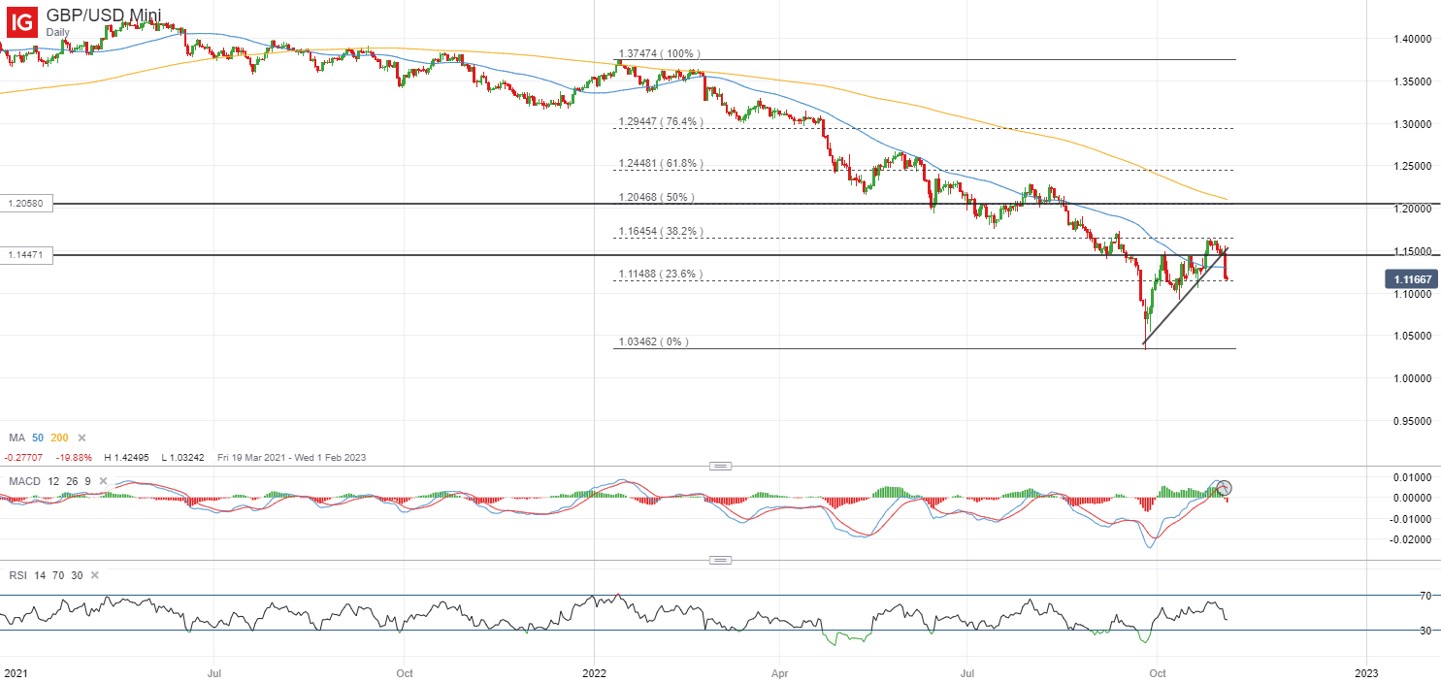
The Bank of England (BoE) meeting yesterday concluded with a 75 basis-point (bp) hike, the most single-meeting move since 1989, but a straight-on guidance from the Governor and downbeat economic forecasts suggest that rate hikes of such scale may not continue ahead. Comments from its Governor, Andrew Bailey, indicated bluntly that the current rate expectations in financial markets are more aggressively than what the central bank views, which triggered an unwinding of hawkish bets overnight. On the technical front, the GBP/USD has broken above an ascending triangle pattern last week but has currently failed to sustain. The 2.5% plunge overnight dragged it back towards the 1.114 level, where a 23.6% Fibonacci retracement resides. With forecasts for inflation to hit a 40-year high during the current quarter, while the UK economy to face contraction in 2023 and 2024, it seems likely that the GBP/USD could retain its downward bias moving forward.
 Source: IG charts
Thursday: DJIA -0.46%; S&P 500 -1.06%; Nasdaq -1.73%, DAX -0.95%, FTSE +0.62%


.jpeg.98f0cfe51803b4af23bc6b06b29ba6ff.jpeg)


0 Comments
Recommended Comments
There are no comments to display.
Create an account or sign in to comment
You need to be a member in order to leave a comment
Create an account
Sign up for a new account in our community. It's easy!
Register a new accountSign in
Already have an account? Sign in here.
Sign In Now