Nvidia share price and Q3 earnings results preview

Entry posted by MongiIG in Market News
1,138 views
What to expect and how to trade Nvidia’s upcoming results from a fundamental and technical perspective.
 Source: Bloomberg
When are Nvidia’s results expected?
NVIDIA Corp (All Sessions) is set to release its third quarter (Q3) 2022 results on 16 November 2022. The results are for the fiscal quarter ending September 2022.
What is ‘The Street’s’ expectation for the Q3 2022 results?
‘The Street’ expectations for the upcoming results are as follows:
Revenue of $5,804 billion : -18.28% year on year (YoY)
Earnings per share (EPS): $0.70 (-40.05% YoY)
The Nvidia share price has been boosted by the company’s announcement on Monday that it is offering a new advanced chip in China which meets recent export control rules aimed at preventing China from purchasing cutting-edge technology from the US.
The new chip, called the A800, should boost Nividia’s revenues which had been under threat due to the new US trade rules and export limitations.
In August Nvidia said that its advanced data centre chip A100 had been added to the export control list by the US Commerce Department and since early October had effectively been banned from being exported to China.
Since the A800 can be used in place of the A100 and both are graphics processing units (GPUs), Nvidia’s exports to China should no longer be too affected by the recent US export controls.
How to trade Nvidia into the results
 Source: Refinitiv
Refinitiv data shows a consensus analyst rating of ‘buy’ for Nvidia – 11 strong buy, 20 buy and 13 hold - with the median of estimates suggesting a long-term price target of $190.00 for the share, roughly 28% higher than the current price (as of 8 November 2022).
 Source: IG
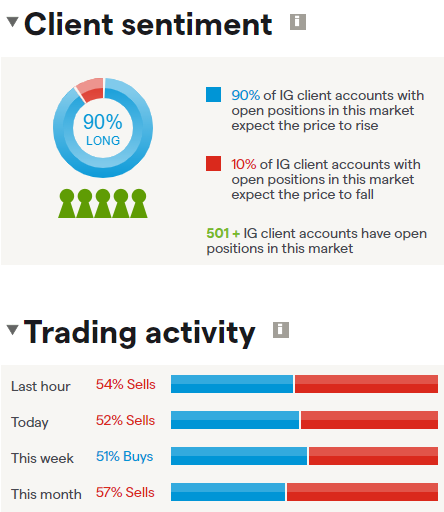
IG sentiment data shows that 90% of clients with open positions on the share (as of 8 November 2022) expect the price to rise over the near term, while 10% of these clients expect the price to fall whereas trading activity over the last week showed 51% of buys and this month 57% of sells.
Nvidia – technical view
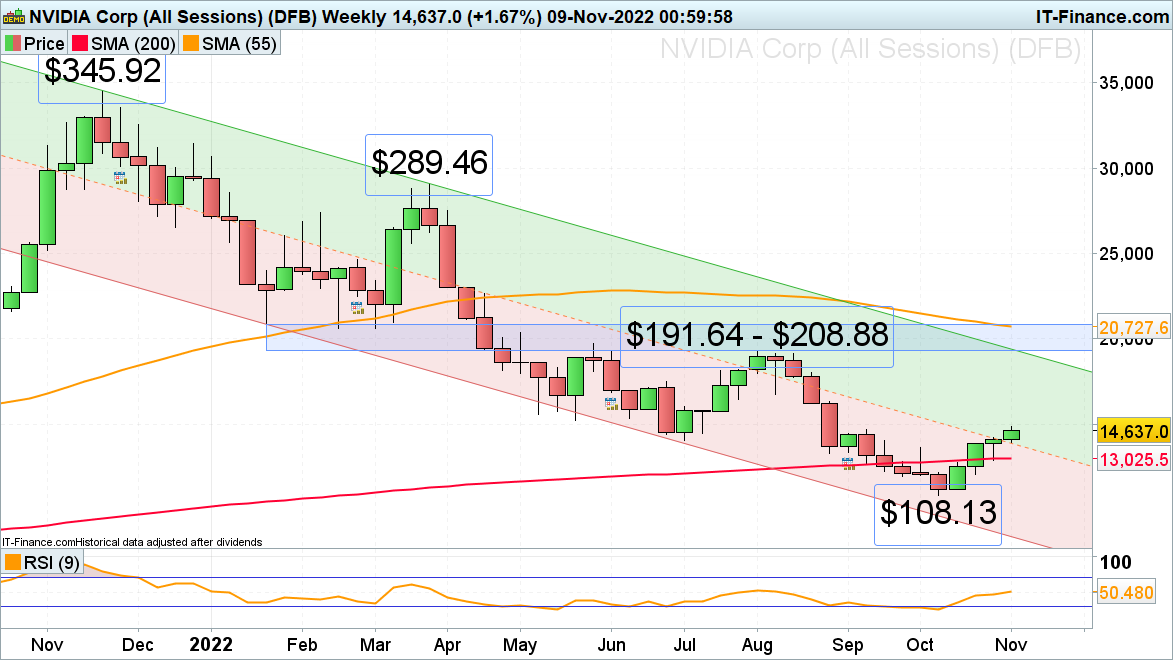
The Nvidia share price has been slipping since March 2021 and dropped by around 62% to its $108.13 October low before rising back towards the minor psychological $150 mark since, still down 51% year-to-date, though.
 Source: ProRealTime
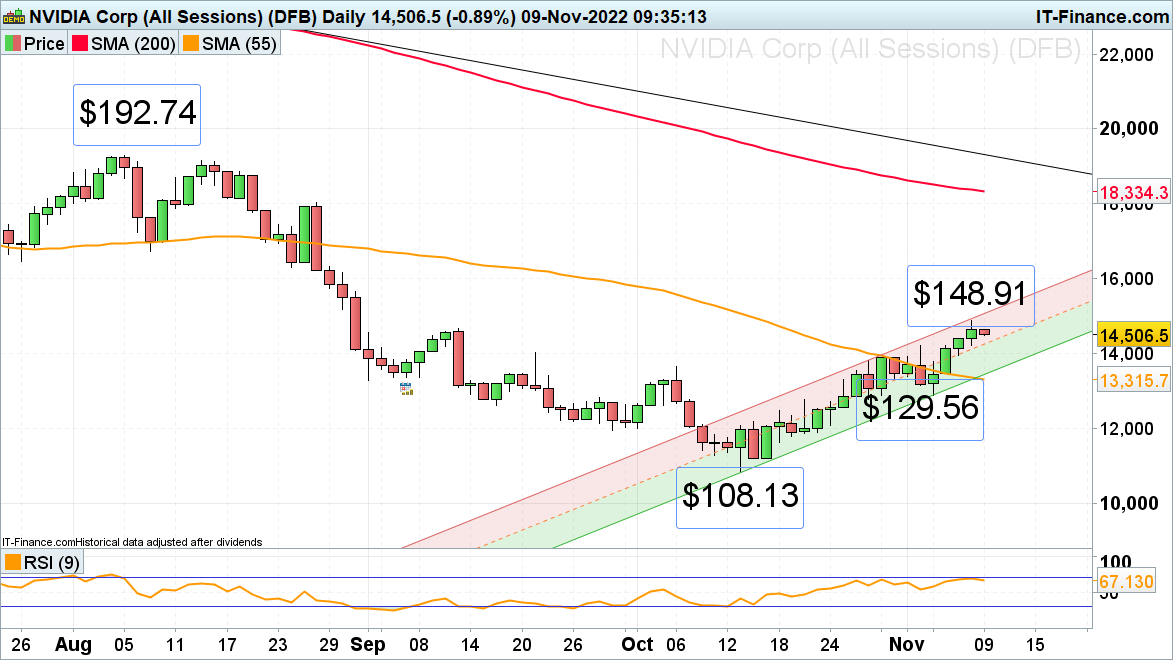
From a technical perspective the share price is in the process of at the very least forming a minor bullish reversal, having made a series of higher highs and lows within its October-to-November uptrend channel. For such a bullish reversal pattern to be confirmed, at least two consecutive daily or one weekly chart close above the mid-September high at 145.47 would need to be seen.
If so, the late July and early August lows at $164.78 to $167.24 would be next in line. Further up lies major resistance between the January-to-March lows and the June-to-August highs at $191.64 to $208.88. These upside targets will remain in sight while the early November low at $129.56 underpins.
 Source: ProRealTime
Were the $129.56 low to be slipped through, however, the long-term downtrend would be deemed to have resumed with the $108.13 October trough, the minor psychological $100 mark, and the March 2020 pandemic low at $89.00 being eyed.
Summary
Nvidia is set to release Q3 2022 results on 16 November 2022.
Q3 2022 results are expected to show a 18% YoY decrease in revenue and a 40% decrease in EPS.
Revenue is expected to be boosted by the company’s announcement on Monday that it is offering a new advanced chip in China which meets recent US export control rules.
Long-term broker consensus suggests the share to currently be a ‘buy’, with a median price target of $190.00.
90% of IG’s clients with open positions are long the share but trading activity over the last week showed 51% of buys and this month 57% of sells.
The Nvidia share price has been slipping since March 2021 and year-to-date trades down by around 51% but is in the process of at least short-term forming a bullish reversal pattern.
The share would need to see a at least two consecutive daily or one weekly chart close above the mid-September high at 145.47 for the late July and early August lows at $164.78 to $167.24 to be next in line. Further up lies major resistance between the January-to-March lows and the June-to-August highs at $191.64 to $208.88.


0 Comments
Recommended Comments
There are no comments to display.
Create an account or sign in to comment
You need to be a member in order to leave a comment
Create an account
Sign up for a new account in our community. It's easy!
Register a new accountSign in
Already have an account? Sign in here.
Sign In Now