Markets on a breather after recent upside: DJIA, ASX 200, EUR/USD

Entry posted by MongiIG in Market News
1,029 views
The US equity markets failed to keep up with its previous gains overnight, as broad selling pressure hit all 11 S&P 500 sectors.
 Source: Bloomberg
Market Recap
The US equity markets failed to keep up with its previous gains overnight, as broad selling pressure hit all 11 S&P 500 sectors. Notably, the communication services sector was the worst performer (-4.1%), dragged lower by a 7.4% plunge in Alphabet’s share price. Market participants seem unimpressed with the company’s new AI chatbot, Bard, which is a retaliation to recent push by Microsoft and Baidu in using AI for their search engines. A factual error presented by the chatbot in a promotional video seems to be the subject of scrutiny. Elsewhere, the quiet tone on the economic calendar left corporate earnings in focus, with Disney’s share price surging 5.5% after-market. Cost-cutting measures amounting to $5.5 billion, which includes cutting 7,000 jobs, are looked upon positively, along with its recent quarterly earnings beat.
Aside, comments from Federal Reserve (Fed) official Christopher Waller displayed a tough stance to recent dovish expectations by suggesting that interest rates may be higher for longer than some are currently expecting. Despite some paring back in US Treasury yields, the US dollar held firm, not providing any reason to cheer for the risk environment overnight. Ahead, the US weekly jobless claims will be in focus, with signs of moderation in the labour market preferred by market bulls as opposed to the strength presented in the recent US job report. The Dow Jones Industrial Average (DJIA) continues to trade in a range but is hovering just below the upper resistance of the consolidation pattern. Any break above the 34,400 level will be on watch to pave the way towards the 35,500 level. On the other hand, any move below the 33,760 level could set the 32,800 level in sight.
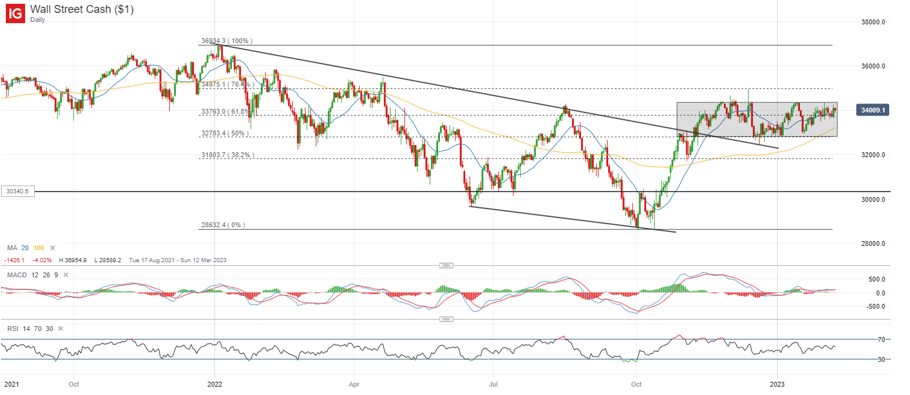 Source: IG charts
Asia Open
Asian stocks look set for a negative open, with Nikkei -0.56%, ASX -0.21% and KOSPI -0.55% at the time of writing. The lack of a positive follow-through from Wall Street is keeping risk sentiments in check, especially with the VIX finding its way 5.2% higher overnight. The Nasdaq Golden China Index is 1.7% lower, with the Hang Seng Index failing to see any significant pick-up yesterday. A continued drift lower could remain the near-term bias here, but more muted moves coming after the previous heavier sell-off may seem to suggest an attempt to stabilise over the coming days. The key focus on the economic calendar will be China’s inflation readings released tomorrow.
The ASX 200 index has made an attempt to retest its one-year high at the 7,600 level, which was met with some selling pressure on key resistance. A bearish crossover was displayed on moving average convergence/divergence (MACD) for now, indicating some easing upward momentum. Greater conviction for the bears could come from a break below the 7,450 level, where a previous phase of consolidation had played out. On the other hand, any subsequent move back to retest its one-year high could pose another challenge to the supply of sellers at the key resistance, raising the odds of an upward breakout.
 Source: IG charts
On the watchlist: EUR/USD struggling to stay in its channel pattern for now
With the resilience presented in the US dollar lately, the EUR/USD seems to be struggling to stay in its near-term channel pattern for now, as upside momentum has moderated with the declining MACD. On the weekly timeframe, a bearish shooting star was also completed last week, which raised the odds of further retracement after surging more than 15% since September 2022. A downward break of the channel pattern could leave the 1.060 level in focus, followed by the 1.037 level, where various Fibonacci retracement levels stand.
 Source: IG charts
Wednesday: DJIA -0.61%; S&P 500 -1.11%; Nasdaq -1.68%, DAX +0.60%, FTSE +0.26%


.jpeg.98f0cfe51803b4af23bc6b06b29ba6ff.jpeg)


0 Comments
Recommended Comments
There are no comments to display.
Create an account or sign in to comment
You need to be a member in order to leave a comment
Create an account
Sign up for a new account in our community. It's easy!
Register a new accountSign in
Already have an account? Sign in here.
Sign In Now