Key stock indices: precariously perched, what comes next for the S&P, Nasdaq, Dow Jones and FTSE?

Entry posted by MongiIG in Market News
491 views
What can traders expect as the markets remain mixed?
 Source: Bloomberg
US stock markets extended falls overnight as the meeting minutes of the January FOMC minutes failed to give details about the criteria for a Fed pause and noted that a “few” members called for a 50 bp rate rise to slow inflation.
The stronger-than-expected data since the meeting took place, particularly the January Jobs report and higher-than-expected CPI and PPI released, had made the minutes mostly updated.
The U.S. interest rate market has since added two 25 bp rate rises to the expected Fed peak rate (from 4.9% to ~5.4%), and now prices a not insignificant 27% chance of a step up to a 50 bp rate hike when the Fed meets in March.
Supporting the idea of a step up, St Louis President James Bullard, one of the most accurate and hawkish Fed voices during its tightening cycle, said fears of a recession were overstated and reiterated his thoughts that a more aggressive interest rate hike now would give the Fed a better chance of taming inflation.
As noted in our preview earlier in the week, a terminal Fed Funds rate with a five handle in front of it doesn’t seem quite enough in the context of an inflation rate still at twice the Feds target and an unemployment rate at 3.4%, the lowest level since 1969.
With the Q4 2022 earnings season now in the home straight attention into the end of this week will focus on the release tonight of Jobless claims which are expected to rise by 6k to 200k. As well as the release on Friday of the Fed’s preferred measure of inflation on Core PCE is expected to remain unchanged at 4.4% YoY.
With key equity markets wobbling under pressure from higher yields, there isn’t much breathing room for either of these prints to come in much hotter than expected.
S&P 500 technical analysis
Overnight the S&P 500 tested and held the uptrend support at 3990 from the October lows. Not far below is the all-important 200-day moving average (MA) at 3950. If the 3990/50 support band holds, this would allow the rally from the October low (viewed as countertrend or corrective) to resume towards the August 4327 high before fading.
Aware that should the S&P 500 see a sustained close below 3990/50, it would confirm that the rally from the October lows has been corrective, and the downtrend has resumed.
S&P 500 daily chart
 Source: TradingView
Nasdaq technical analysis
Overnight the Nasdaq extended its decline from its February 12,950 high towards the 200-day MA at 11,950. Providing that the Nasdaq holds above 11,950, it would allow the rally from October's low to move higher towards the August 13,740 high.
Aware that a sustained close back below the 200-day MA at 11,950 would confirm that the rally from the October low has been corrective and the downtrend has resumed.
Nasdaq daily chart
 Source: TradingView
Dow Jones technical analysis
The Dow Jones has spent the first two months of 2023 consolidating its +20% gains from the October 28,660 low.
If Dow Jones remains above the December 32,573 low and the 200-day MA at 32,342, it is viewed as two months of corrective price action. We expect the Dow Jones to test and break its December 34,712 high before moving towards April 2022's 35492 high.
Dow Jones daily chart
 Source: TradingView
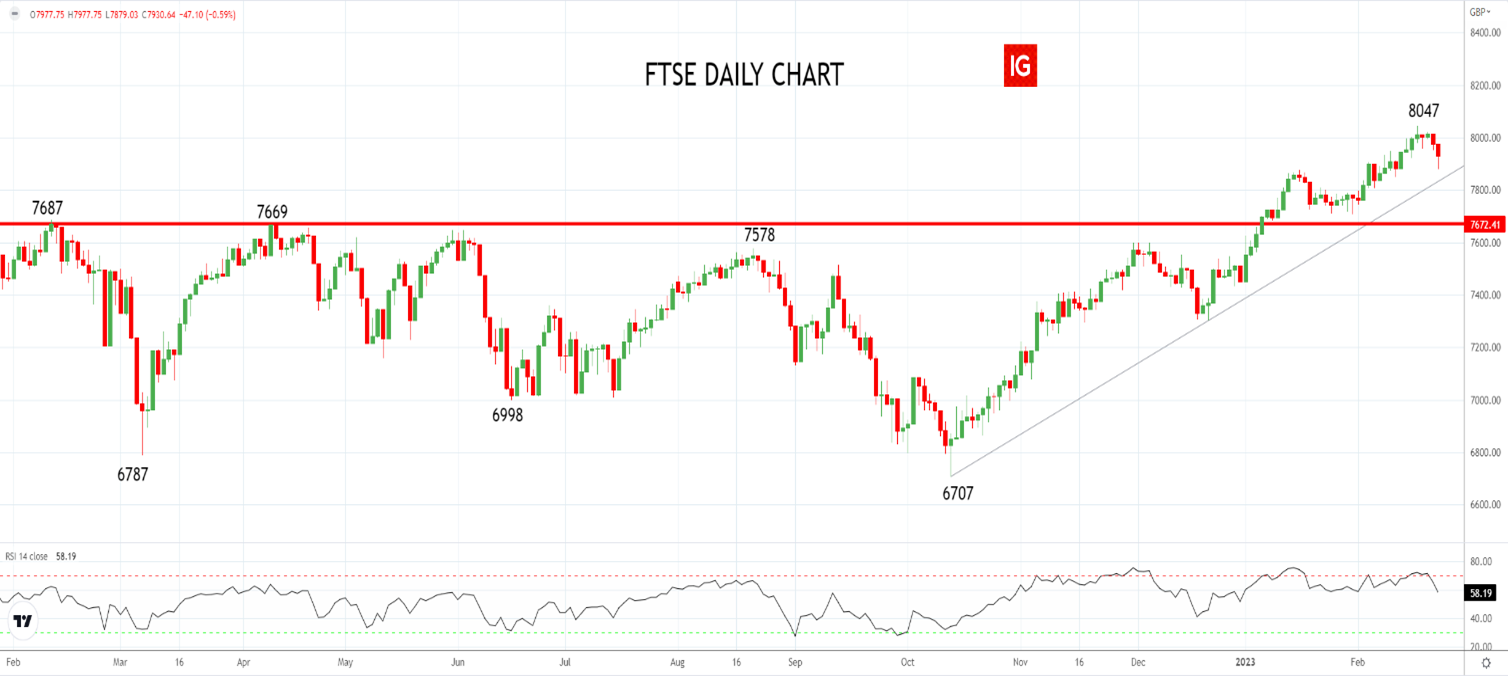
FTSE technical analysis
After a strong start to 2023, The FTSE declined overnight for a second straight session, taking its lead from Wall Street's weakness and Rio Tinto’s earnings report. Rio Tinto's stock fell 37.9% to $13.28 billion, missing an expectation of $13.96 billion.
The pullback has uptrend support from the October 6707 low coming in at 7850ish. This short-term support needs to hold to avoid a deeper pullback unfolding toward the highs of the 2022 7700/7650 area.
FTSE daily chart
 Source: TradingView
TradingView: the figures stated are as of February 23rd, 2023. Past performance is not a reliable indicator of future performance. This report does not contain and is not to be taken as containing any financial product advice or financial product recommendation


.jpg.27c55ea07d5a17683fbdbda06b8fcace.jpg)
0 Comments
Recommended Comments
There are no comments to display.
Create an account or sign in to comment
You need to be a member in order to leave a comment
Create an account
Sign up for a new account in our community. It's easy!
Register a new accountSign in
Already have an account? Sign in here.
Sign In Now