Another down day for Wall Street with upmove in Treasury yields: US dollar, Straits Times Index, GBP/EUR
Major US indices continue to come under pressure overnight, as the release of the US ISM manufacturing PMI reading adds to the list of recent data pointing to a challenging ‘disinflation’ process.
 Source: Bloomberg
Market Recap
Major US indices continue to come under pressure overnight, as the release of the US Institute for Supply Management (ISM) manufacturing Purchasing Managers' Index (PMI) reading adds to the list of recent data pointing to a challenging ‘disinflation’ process. While the overall figure came in lower than expected (47.7 versus 48 forecast), the prices paid by manufacturers surprised to the upside by a wide margin (51.3 versus 45.1 forecast). This marks the first time prices have reverted back into expansionary territory since October 2022. While it could take more data to confirm a trend, rate hike expectations recalibrated to the data with further bets towards a higher terminal rate. Federal Reserve (Fed) policymakers also followed up with a hawkish echo, with the Fed voting member, Neel Kashkari, putting the possibility of a 50 basis-point hike on the table this month.
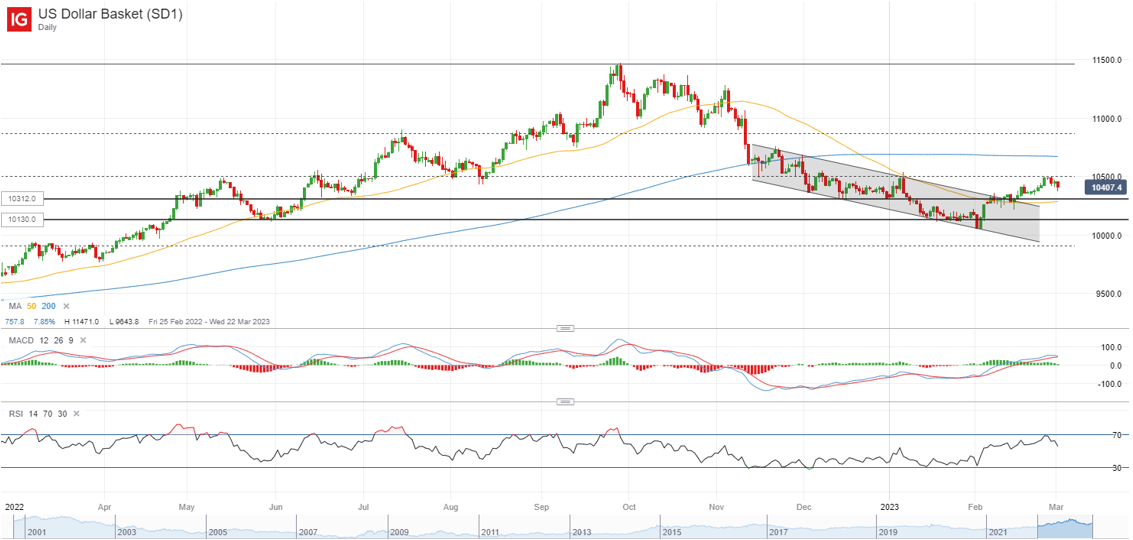
With that, the two-year Treasury yields touched a new high since 2007, while the ten-year yields crossed the 4% level. That puts the pressure on rate-sensitive growth sectors, with big tech stocks unwinding their previous gains. Apple’s share price has fallen below its 200-day moving average (MA). Despite rising rate expectations, the US dollar failed to move higher overnight, as the 105.00 level remains a key resistance level to overcome. A break above this level could open the path to retest its 200-day MA next. With the US dollar taking a breather, gold and silver prices saw some room for relief, with technical conditions revealing a shift into neutral territory from previous oversold levels.
 Source: IG charts
Asia Open
Asian stocks look set for a slightly positive open, with Nikkei +0.28%, ASX +0.38% and KOSPI +0.68% at the time of writing. Following the outperformance in China’s PMI readings for the second straight month, the Hang Seng Index has delivered strong gains (+4.2%) in yesterday’s session, rejecting a retest of its key 200-day MA. The session today may be more measured however, as the Nasdaq Golden Dragon China Index saw some paring of gains after an initial jump higher, with the broader risk environment not providing much of a tailwind.
The Singapore’s SIPMM manufacturing PMI figure will be released today, with its manufacturing activities trending into contractionary territory for the past five consecutive months. Further weakness is expected, as global economic conditions weigh while the positive knock-on impact from China’s recovery could take some time to play out.
For the Straits Times Index (STI), two consecutive weeks of aggressive net outflows from institutional investors have brought the index back towards a previous consolidation base at the 3,230 level. Any break lower could open the door to retest the 3,170 level next. The index’s heavyweight, DBS, is currently trading back below its 200-day MA for the first time since August 2022, which may keep the pressure on the index.
 Source: IG charts
On the watchlist: GBP/EUR plunged on Germany’s inflation surprise
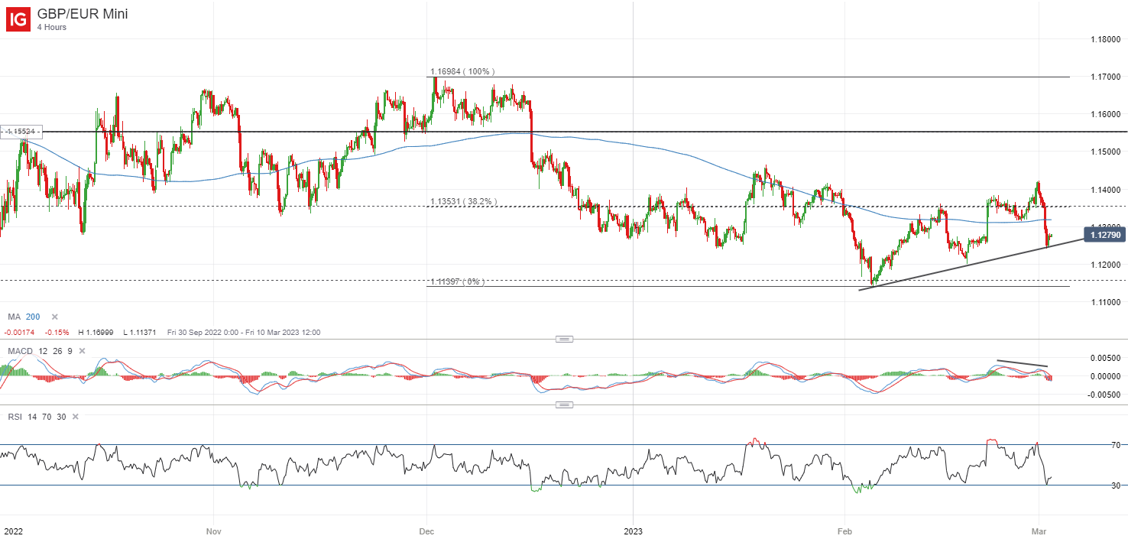
Expectations for a disinflationary trend in Germany were challenged yesterday, as headline inflation reading surprised to the upside, coming in at 8.7% versus 8.5% forecast (harmonised rate at 9.3% versus 9% forecast). The data should keep the European Central Bank (ECB) firmly on its hawkish path, with a 50 basis-point hike in March looking to be a done deal. To add to the downside pressure for GBP/EUR, UK house prices saw its first annual fall in three years, reinforcing a slowdown in economic conditions.
On the four-hour timeframe, the sell-off in GBP/EUR follows after the formation of a bearish divergence on Moving Average Convergence/Divergence (MACD). This brought the pair to retest a key upward trendline, which is attempting to keep the higher-lows narrative. A break below the trendline support could pave the way towards its February low at the 1.114 level. Resistance to overcome will be at the 1.135 level, where a Fibonacci confluence zone resides.
 Source: IG charts
Wednesday: DJIA +0.02%; S&P 500 -0.47%; Nasdaq -0.66%, DAX -0.39%, FTSE +0.49%


.jpg.27c55ea07d5a17683fbdbda06b8fcace.jpg)
.png.02f0e5e742ffe3a81b011c17df3009ee.png)
0 Comments
Recommended Comments
There are no comments to display.
Create an account or sign in to comment
You need to be a member in order to leave a comment
Create an account
Sign up for a new account in our community. It's easy!
Register a new accountSign in
Already have an account? Sign in here.
Sign In Now