Bullish turn to end last week: S&P 500, Hang Seng Index, Brent crude

Entry posted by MongiIG in Market News
553 views
A bullish turn towards the end of last week allowed major US indices to defend their respective 200-day MAs, with the potential formation of a higher low keeping hopes of further upside alive.
 Source: Bloomberg
Market Recap
A bullish turn towards the end of last week allowed major US indices to defend their respective 200-day moving averages (MA), with the potential formation of a higher low keeping hopes of further upside alive. Comments from Federal Reserve (Fed) officials continued to call for higher rates to tame inflation, while the release of US Institute for Supply Management (ISM) services Purchasing Managers Index (PMI) data last Friday revealed stronger-than-expected economic activities as an upside risk to pricing pressures.
At least for now, however, market expectations for Fed’s rate outlook have remained well-anchored after recalibrating to stronger inflation data over the past month. That puts the Treasury yields rally on some breather to end last week, with the US ten-year yields retracing by 11 basis-points. Likewise, the US dollar continues to struggle at its key 105.00 level, while the VIX was also significantly lower, heading back to retest its mid-February low.
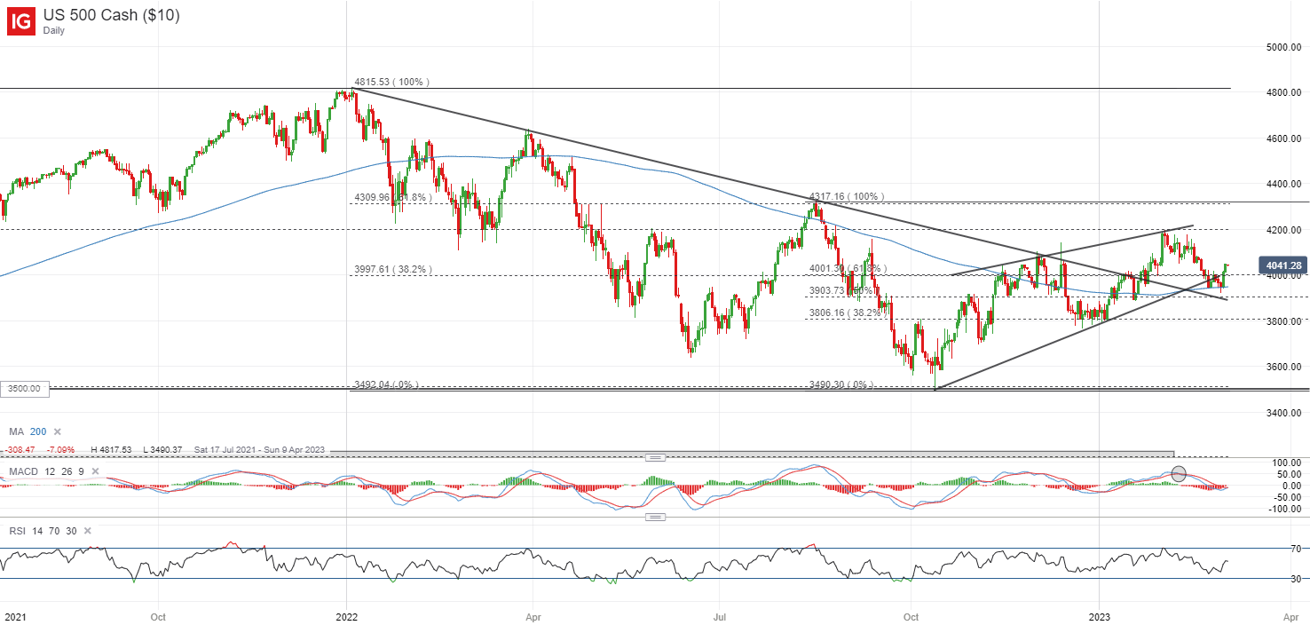
With that, the S&P 500 has reclaimed its key 4,000 level, with an upside bias until the 200-day MA is breached. Seasonality in the month of March may generally be more positive as compared to February, but much focus will be on Fed Chair Jerome Powell’s testimony and US non-farm payroll data to provide any go-ahead this week.
The Fed Chair could likely refrain from bringing up his previous ‘disinflation’ narrative and displayed resolve in taming inflation, but there is still a possibility for equities’ upside if markets perceive a no-change to recent rate pricing. More sustained moves may be driven by hard data – US non-farm payroll this week, where a weaker-than-expected figure will be looked upon by the equity bulls to push back against January’s strong labour data as a one-off.
 Source: IG charts
Asia Open
Asian stocks look set for a positive open, with Nikkei +1.21%, ASX +0.55% and KOSPI +0.50% at the time of writing. A breather in bond yields provides some room for risk sentiments to recover after recent sell-off, but gains may be more measured, having to digest China’s modest 5% growth target this year as a takeaway from recent National People's Congress (NPC) meeting. The 5% approximate target was at the low end of expectations, challenging hopes of a stronger-than-expected recovery and pointing to a more wait-and-see approach in tapping on large stimulus to support growth. While the less-optimistic takeaway could bring about some near-term profit-taking in Chinese indices, the guidance still signalled a worst-is-over stance and staying above their respective 200-day MA could still leave the overall upward trend intact. That aside, self-reliance on technology and ESG continues to be highlighted as longer-term focus for growth.
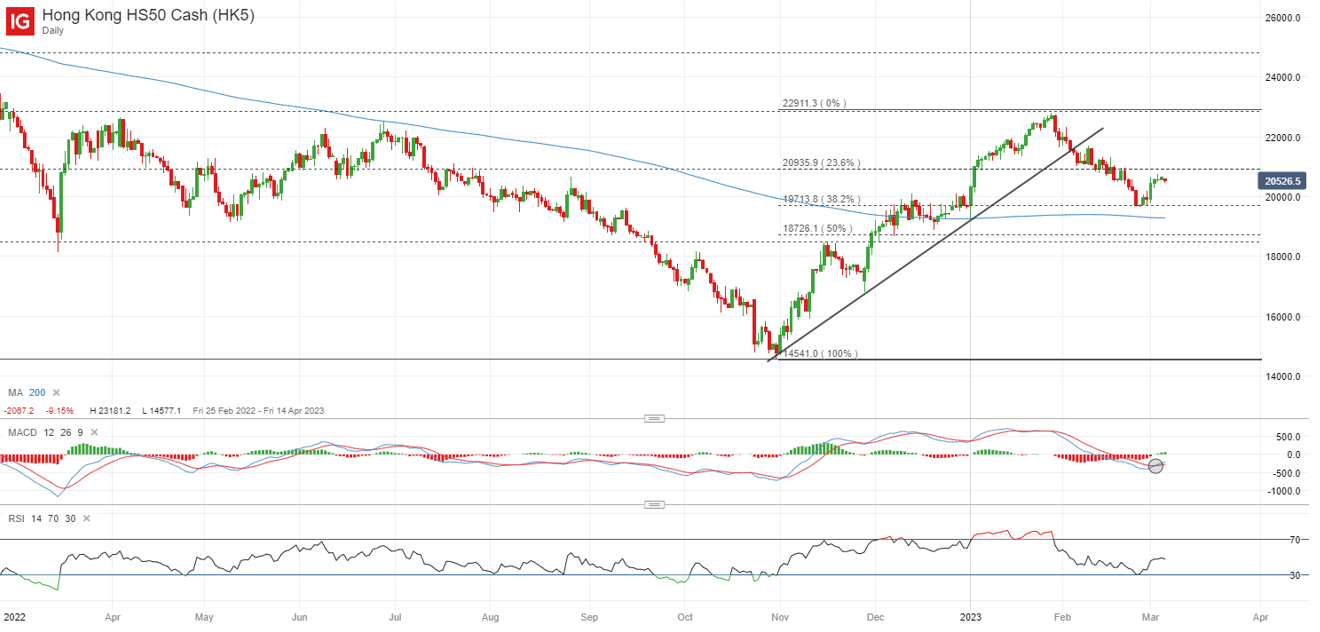
The Hang Seng Index has managed to bounce off its 19,700 level of support last week, with a bullish crossover displayed on Moving Average Convergence/Divergence (MACD) after recent retracement. Upcoming resistance to overcome may be at the 20,935 level, where a Fibonacci confluence stands. Crossing this level could set its sight to retest its January 2023 high.
 Source: IG charts
On the watchlist: Brent crude prices above wedge formation, 100-day MA on watch next
Oil prices have ended higher last week, breaking above a wedge formation despite some conflicting signals that the UAE has an internal debate on exiting the OPEC. With that, prices are back to retest its 100-day MA once more for the third time this year, but are taking a pause on China’s modest growth target over the weekend. Any break above its 100-day MA resistance could still be on watch, potentially paving the way towards the US$92.87 level next. Following a 42% decline over the past one year, the formation of higher lows lately seems to suggest the bulls taking over some control as recession fears have eased from months before with better-than-expected economic data. Any formation of a higher high will be in focus to reinforce the near-term upward bias.
 Source: IG charts
Friday: DJIA +1.17%; S&P 500 +1.61%; Nasdaq +1.97%, DAX +1.64%, FTSE +0.04%


.jpg.27c55ea07d5a17683fbdbda06b8fcace.jpg)
0 Comments
Recommended Comments
There are no comments to display.
Create an account or sign in to comment
You need to be a member in order to leave a comment
Create an account
Sign up for a new account in our community. It's easy!
Register a new accountSign in
Already have an account? Sign in here.
Sign In Now