Relief in sentiments on US authorities’ intervention: US dollar, China A50, EUR/USD

Entry posted by MongiIG in Market News
262 views
Contagion fears in the financial sector remain the overshadowing theme, with the US dollar and Treasury yields heading lower alongside equities last Friday, in what is usually an inverse relationship.
 Source: Bloomberg
Market Recap
To end last week, US job gains surpassed expectations for the 11th consecutive month (311,000 versus 205,000 forecast), revealing a still-robust labour market that should keep the Federal Reserve’s (Fed) tightening in place. However, rate expectations took a less hawkish lean to a 25 basis-point hike at the upcoming March meeting, with terminal rate pricing retreating to the 5-5.25% range as well. Some focus could be on the higher-than-expected unemployment rate (3.6% versus 3.4%), which provided a mixed view to the non-farm payroll data, along with the recent fallout of Silicon Valley Bank which could force the Fed to be more cautious in its tightening moves.
Contagion fears in the financial sector remain the overshadowing theme, with the US dollar and Treasury yields heading lower alongside equities last Friday, in what is usually an inverse relationship. That said, some reassurances have surfaced over the weekend from US officials, who announced to back customer deposits and stem a broader fallout in the financial sector. The move will not lead to losses by American taxpayers and all depositors will be made whole, the statement said. That provided a wave of relief for the risk environment this morning, with US futures heading higher to pare back on last Friday’s losses.
With some ease over the financial contagion worries, attention may shift towards the US inflation data release tomorrow, with expectations that pricing pressures could continue to moderate from the previous month. For the US dollar, it is back to retest February low, after failing to sustain above the 105.00 level. The 103.12 level will be a near-term support confluence to watch, with any breach potentially paving the way to retest the 101.30 level next.
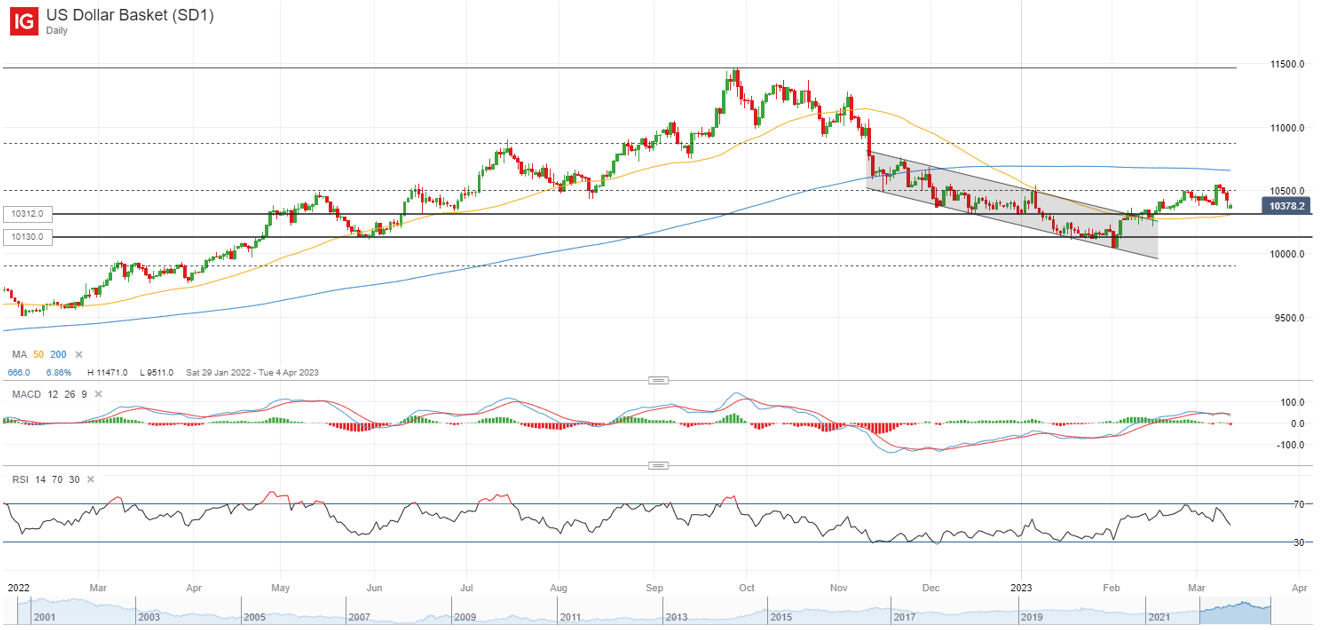 Source: IG charts
Asia Open
Asian stocks look set for a negative open, with Nikkei -1.53%, ASX -0.62% and KOSPI -0.64% at the time of writing. Losses seem more measured, following the reassurances from US officials to try to mitigate the risks of financial shocks in the US, but much caution is still in place. The Nasdaq Golden Dragon China Index is down slightly by just 0.3% last Friday, which may see some attempts for Chinese equities to stabilise to start the new week. That said, the Hang Seng Index has breached its 200-day moving average (MA), with the 19,700 level serving as a key resistance to overcome.
China has announced to retain majority of its cabinet ministers, which supports policy continuity and consistency as the country continues to focus on uplifting economic growth ahead. This includes retaining Yi Gang as governor of the People's Bank of China (PBOC) and appointing Li Qiang as the country’s premier. This is in line with a more modest approach in supportive policies ahead, with some ongoing focus on the risks from excessive credit and money growth.
The China A50 continues to trade on lower highs and lower lows recently, with recent moves back to retest a lower channel trendline. The 13,200 level will be a key resistance to overcome, where its 200-day MA stands alongside a Fibonacci retracement level. Overall, the near-term downward trend may remain until a break above the descending channel pattern occurs.
 Source: IG charts
On the watchlist: Near-term double bottom formation for the EUR/USD
After retracing as much as 4.5% since February this year, the EUR/USD has stabilised into a near-term double-bottom formation, with this morning’s moves retest the formation neckline at the 1.068 level. Its Relative Strength Index (RSI) has formed a higher low, along with an increasing moving average convergence/divergence (MACD), which suggest that selling pressure may have softened for now. Any successful move above the 1.070 level may provide greater conviction of further upside to retest the 1.088 level next.
 Source: IG charts
Friday: DJIA -1.07%; S&P 500 -1.45%; Nasdaq -1.76%, DAX -1.31%, FTSE -1.67%

.jpeg.98f0cfe51803b4af23bc6b06b29ba6ff.jpeg)
.jpeg.573e1479f76cb6c02faab8d9bd670ff8.jpeg)

0 Comments
Recommended Comments
There are no comments to display.
Create an account or sign in to comment
You need to be a member in order to leave a comment
Create an account
Sign up for a new account in our community. It's easy!
Register a new accountSign in
Already have an account? Sign in here.
Sign In Now