US earnings preview: Netflix Q1, 2023

Entry posted by MongiIG in Market News
684 views
Netflix is scheduled to report its first quarter (Q1) earnings at 6am on the 19th AEST, after market close (4pm on the 18th EDT).
 Source: Bloomberg
Key dates
Netflix is scheduled to report its first quarter (Q1) earnings at 6am on the 19th AEST, after market close (4pm on the 18th EDT).
Company profile
Netflix is one of the world's leading entertainment services with 223 million paid memberships in over 190 countries.
During its Q4 2022 earnings report, Netflix surprised investors as it added 7.66 million new subscribers in Q4, smashing its estimation of 4.5 million additions due to both strong acquisition and retention, driven primarily by the success of the Q4 content slate.
The end of 2022 saw Netflix finish with 231m paid memberships.
The other big surprise was that co-CEO Reed Hastings would step down from his position and transition to the post of executive chairman.
The large jump in subscribers in Q4 overshadowed an EPS miss of 12 cents vs 45 cents, largely due to “a $462 million non-cash unrealized loss from the F/X remeasurement on our Euro-denominated debt as a result of the depreciation of the US dollar vs. the Euro during Q4 ’22.”
In a letter to shareholders, Netflix stated:
“2022 was a tough year, with a bumpy start but a brighter finish. We believe we have a clear path to reaccelerate our revenue growth: continuing to improve all aspects of Netflix, launching paid sharing and building our ads offering. As always, our north stars remain pleasing our members and building even greater profitability over time.”
 Source: Bloomberg
What to expect
In its third-quarter earnings report in October last year, Netflix announced that it would no longer provide subscriber guidance for the next quarter (Q1 of 2023) as it shifts its focus away from subs growth towards revenue.
“Revenue is our primary top line metric, particularly as we develop additional revenue streams where membership is just one component of our growth (like advertising and paid sharing).”
Netflix said it would continue to report total streaming subscribers and break out regional sub-figures each quarter as part of its earnings release and it has held true to this decision during its Q4 earnings release in January while at the same time providing Q1'23 guidance in its earnings summary, as viewed below.
Netflix forecasts 2022 v 2023
 Source: Netflix
Key financials: summary
- Revenue: $8.2bn vs $7.85bn in Q4 2022
- Diluted EPS: $2.82 vs $0.12c in Q4 2022
- Net Income: $1.27bn vs $55mn in Q4 2022
Netflix sales revenue chart
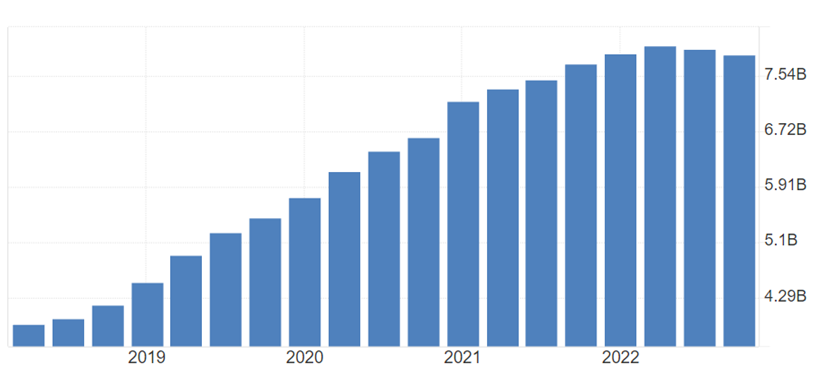 Source: Trading Economics
Key data to watch for
- Product and pricing
Last November, Netflix successfully launched a lower-priced ad-supported plan in 12 countries.
The initial results have been encouraging, and the market will be looking for further evidence that the lower-priced plans are driving incremental membership growth and, in turn, revenue and profit growth.
- Account sharing crackdown
This quarter saw Netflix crack down on widespread account sharing, estimated to be near 100m households. Under the new rules, any account that doesn’t log in to Netflix on the primary location’s WiFi within 31 days will lose access to the account.
The move is expected to force millions of users to sign up for their own plans.
- Competition
Competition in the streaming industry remains intense from competitors, including Disney, which hit 164m subscribers just three years after it commenced streaming. Outside of the streaming industry, Netflix is also facing competition from linear TV, YouTube and TikTok, to name but a few.
As the economic slowdown gathers pace and inflation remains high, the streaming wars will likely intensify and become more challenging and expensive for all operators, including Netflix.
“The silver lining is that the market for entertainment is huge, and Netflix is still very small by comparison”.
Netflix technical analysis
The share price of Netflix fell over 75% from the $700.99 high it traded to in November 2021 to a low of $162.71 in May 2022, as soaring interest rates sent tech stocks into a tailspin and as the company lost subscribers.
Netflix weekly chart
 Source: TradingView
Despite doubling from its 2022 low, the share price of Netflix remains 50% below its bull market high and has spent the past 12 months correctioning the fall by trading in a bearish trend channel.
Should the share price of Netflix extend its rally in the coming session, sellers would be expected to emerge towards the top of the trend channel at $385, looking for rotation back towards support coming from the 200-day moving average at $280.
Ultimately, the bearish trend channel calls for a test and break of the trend channel support coming in at $200.
Neflix daily chart
 Source: TradingView
- TradingView: the figures stated are as of April 8th, 2023. Past performance is not a reliable indicator of future performance. This report does not contain and is not to be taken as containing any financial product advice or financial product recommendation.
Summary
Netflix is scheduled to report its first quarter (Q1) earnings at 6am on the 19th AEST, after market close (4pm on the 18th EDT).
While there is optimism the company can match and exceed guidance, the technical picture suggests that the bounce will likely be capped at around $385 before a push lower towards $280 and then $200.


0 Comments
Recommended Comments
There are no comments to display.
Create an account or sign in to comment
You need to be a member in order to leave a comment
Create an account
Sign up for a new account in our community. It's easy!
Register a new accountSign in
Already have an account? Sign in here.
Sign In Now