Countdown to US CPI data release: Russell 2000, AUD/JPY, Brent crude

Entry posted by MongiIG in Market News
1,099 views
The trend over the past months has been for a weaker US dollar post-CPI, so if that plays out, it could provide a catalyst for risk sentiments to recover further.
 Source: Bloomberg
Market Recap
The countdown to the upcoming US inflation data release translated to another lacklustre session in Wall Street overnight (DJIA -0.17%; S&P 500 -0.46%; Nasdaq -0.63%), while continued impasse over US debt ceiling talks did not provide any catalyst to cheer as well. The VIX was 4.3% higher as hedging activities mount, while Treasury yields did not make much of a move as rate expectations stood well-anchored.
Expectations are for the upcoming US headline inflation to come in unchanged at 5% year-on-year, while core aspects could tick slightly lower to 5.5% from previous 5.6%. Month-on-month, both readings are expected to come in at a 0.4% increase from March.
Inflation-forecasting data from the Cleveland Federal Reserve (Fed) suggests that there are upside risks to those readings, but the tendency for the Fed’s forecasts to overstate the actual consumer price index (CPI) over the past months may still provide a mixed view. Upside surprises in the US job report last week have also failed to drive much of a change in rate expectations, suggesting that it could have to take a significant pull-ahead in inflation readings to alter market expectations for an upcoming rate pause, along with 75 basis-point rate cuts by the end of the year.
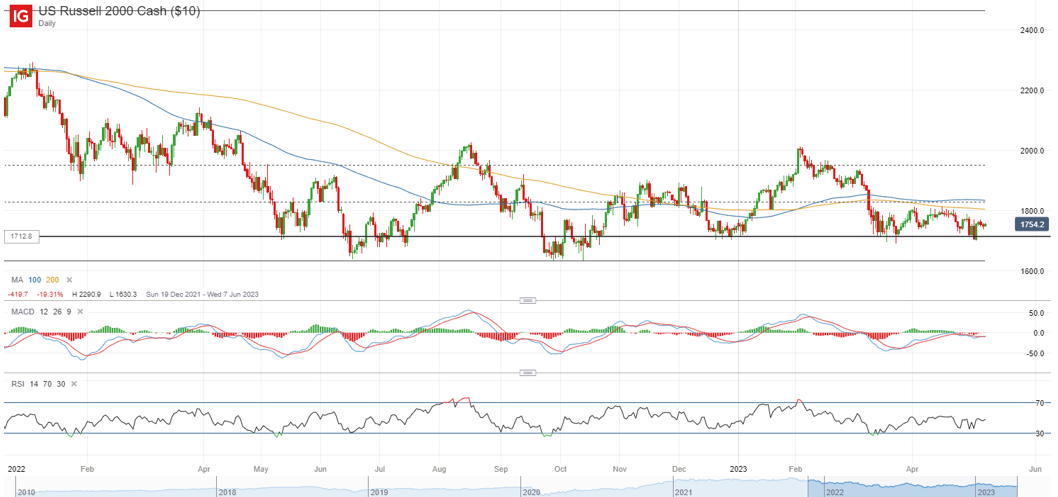
The trend over the past months has been for a weaker US Dollar post-CPI, so if that plays out, it could provide a catalyst for risk sentiments to recover further. The Russell 2000 has been stuck in a longer-term ranging pattern since June 2022, with recent down-move bringing the index back to retest a key support at the 1,700 level. Failure for the level to hold may put its 2022 bottom in sight next. Greater conviction for the bulls may have to come from a move back above the 1,830 level to reclaim both its 100-day and 200-day moving average (MA).
 Source: IG charts
Asia Open
Asian stocks look set for a weaker open, with Nikkei -0.34%, ASX -0.30% and KOSPI -0.18% at the time of writing. Stronger-than-expected exports (8.5% versus 8% forecast) failed to convince market participants of China’s recovery yesterday as it still reflects a slowdown in growth momentum, accompanied with a surprise contraction in imports (-7.9% versus 0% forecast). The Hang Seng Index was down 2% yesterday, still attempting to keep its head afloat above its 200-day MA.
The Australia’s budget speech may not provide much of a surprise yesterday, with an expected $14.6 billion cost-of-living support package over four years. For the AUD/JPY, the pair is headed back to retest a key downward trendline resistance, which coincides with its 200-day MA. The formation of a shooting star candlestick last week suggests the presence of strong sellers at the 92.40 level, which will be a resistance to overcome ahead. For now, movement seems to fall within a rising channel pattern, with the lower channel support at the 89.00 level on watch in the event of any retracement.
 Source: IG charts
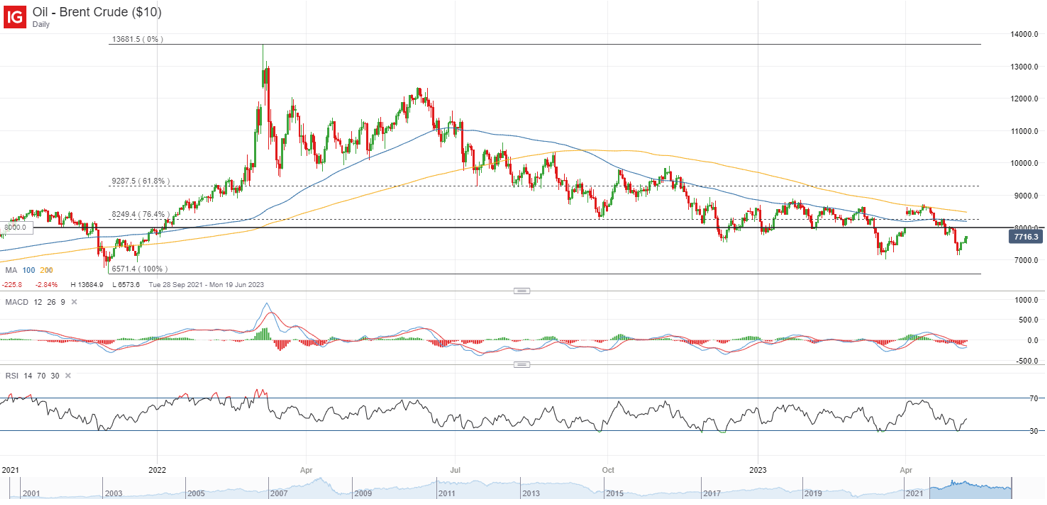
On the watchlist: Brent crude prices on its fourth day of gains
Following a heavy 10% sell-off last week, Brent crude prices have managed to regain some footing lately with its fourth straight day of gains. OPEC-driven gains has been completely unwound thus far, with mounting global economic risks and a more lukewarm recovery on the China’s front keeping sentiments in check. That said, IG client sentiment data suggests that retail client positioning is unwinding from an extreme net-long level (85-90%), which tends to coincide with some of the near-term lows in oil prices and suggests potential room for further recovery.
A series of resistance will be on watch to overcome, which includes its 100-day MA at the US$82.50 level. Further upmove towards the US$87.00 level will also put a double-bottom in place, with the level serving as neckline resistance to tackle. On the downside, dip-buying has been previously sighted at the US$70.00 level, which will serve as potential support to watch.
 Source: IG charts
Tuesday: DJIA -0.17%; S&P 500 -0.46%; Nasdaq -0.63%, DAX +0.02%, FTSE -0.18%


0 Comments
Recommended Comments
There are no comments to display.
Create an account or sign in to comment
You need to be a member in order to leave a comment
Create an account
Sign up for a new account in our community. It's easy!
Register a new accountSign in
Already have an account? Sign in here.
Sign In Now