Higher Treasury yields triggered profit-taking in Nasdaq overnight: US energy sector, ASX 200, Gold

Entry posted by MongiIG in Market News
229 views
A quiet US economic calendar overnight shifted much of the market focus to the Bank of Canada (BoC), who became the second central bank to deliver a hawkish surprise this week.
 Source: Bloomberg
Market Recap
A quiet US economic calendar overnight shifted much of the market focus to the Bank of Canada (BoC), who mirrored the Reserve Bank of Australia (RBA)’s decision this week with a surprise 25 basis-point (bp) increase. With that, it became the second central bank to reject broad expectations of a rate pause, serving as a reminder that rate pauses from central banks are more of a wait-and-see, rather than a clear end to tightening. The decision reinforces views that we may still see additional tightening from the Federal Reserve (Fed) after its June meeting, placing a potential hawkish-pause scenario on the table next week.
Treasury yields moved higher as a result, with the 10-year yields up close to 15 basis-points. With the rate-sensitive Nasdaq 100 index trending in overbought territory lately, that triggered a slew of profit-taking which took the index down 1.3%. The rotation was visible towards small-cap stocks for the second straight day, with the US Russell 2000 index defying the broader trend with a 1.9% gain.
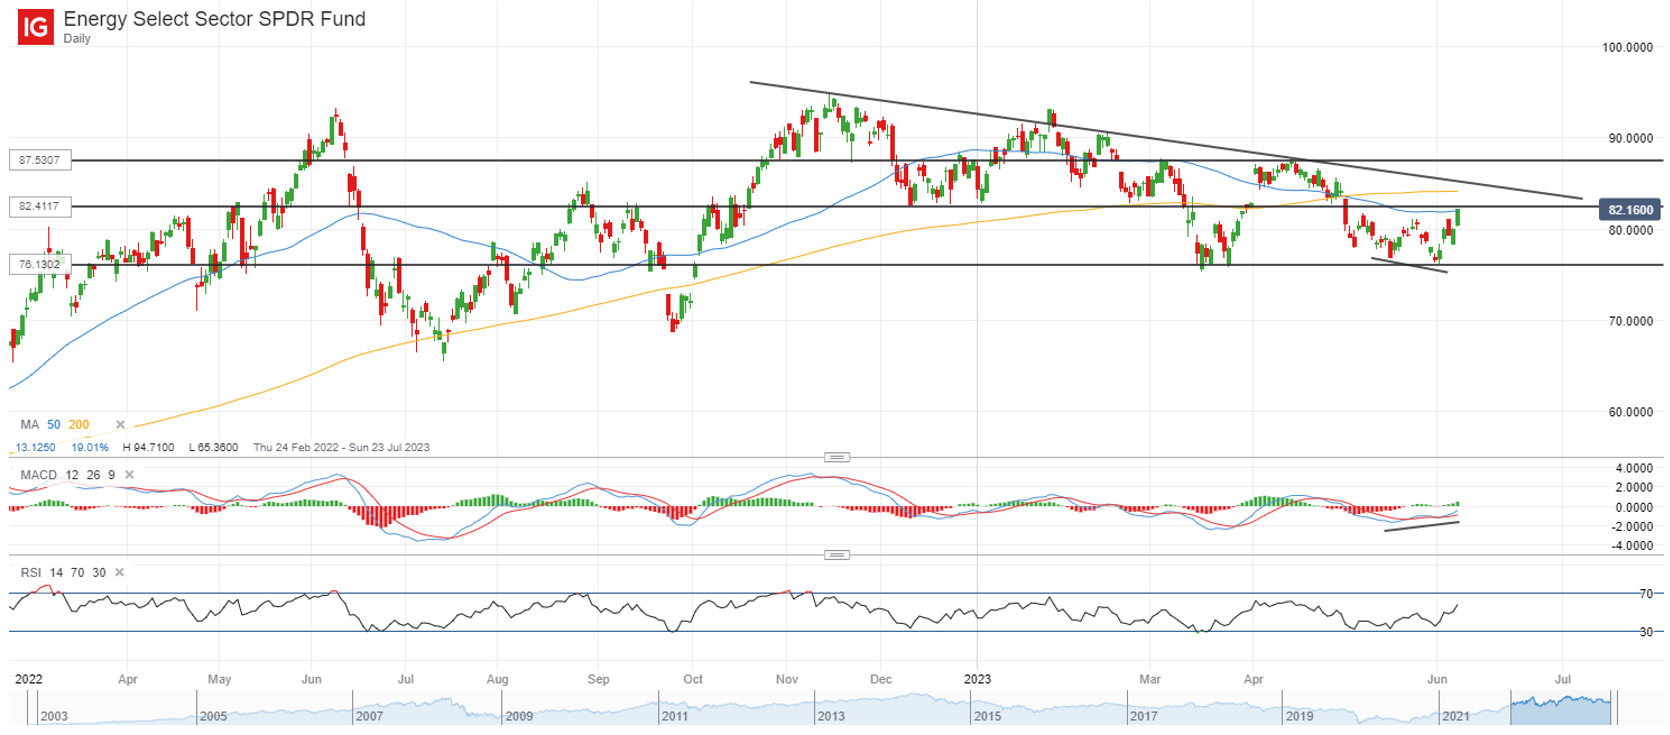
The energy sector is the outperformer overnight (+2.7%), tracking an in-tandem 1.3% rise in oil prices, which paved the way for a new one-month high for the Energy Select Sector SPDR Fund. That said, it seems that a series of resistance still has to be overcome in order to provide greater conviction of a more sustained upside. An immediate resistance at the 82.40 level is currently in the way, with its 50-day moving average (MA) in confluence with a horizontal support-turned-resistance. Further upside will also have to challenge a downward trendline resistance, along with its 200-day MA.
 Source: IG charts
Asia Open
Asian stocks look set for a subdued open, with Nikkei +0.17%, ASX -0.01% and KOSPI -0.28% at the time of writing. A positive surprise came from Japan’s revised 1Q gross domestic product (GDP) growth, with the 2.7% growth towering above the expected 1.9%. Quarter-on-quarter, it registered a 0.7% increase versus the 0.5% forecast, as a 0.5% increment in capital spending’s growth more than offset a slight 0.1% downward revision in private consumption.
While a higher growth reading may provide some room to consider a policy exit from the Bank of Japan (BoJ), the central bank’s stance could remain unmoved for now, with recent comments from the Governor Kazuo Ueda pointing to more wait-and-see. Japan’s Citi economic surprise index supported that stance with a sharp moderation since March this year, which provides less conviction that current strength may be mirrored over coming quarters.
Ahead, the economic calendar will leave the Reserve Bank of India’s (RBI) interest rate decision on watch. Broad expectations are for a rate pause from the central bank, considering that inflationary pressures have been easing towards the central bank’s target (4.7% in April versus 4% target).
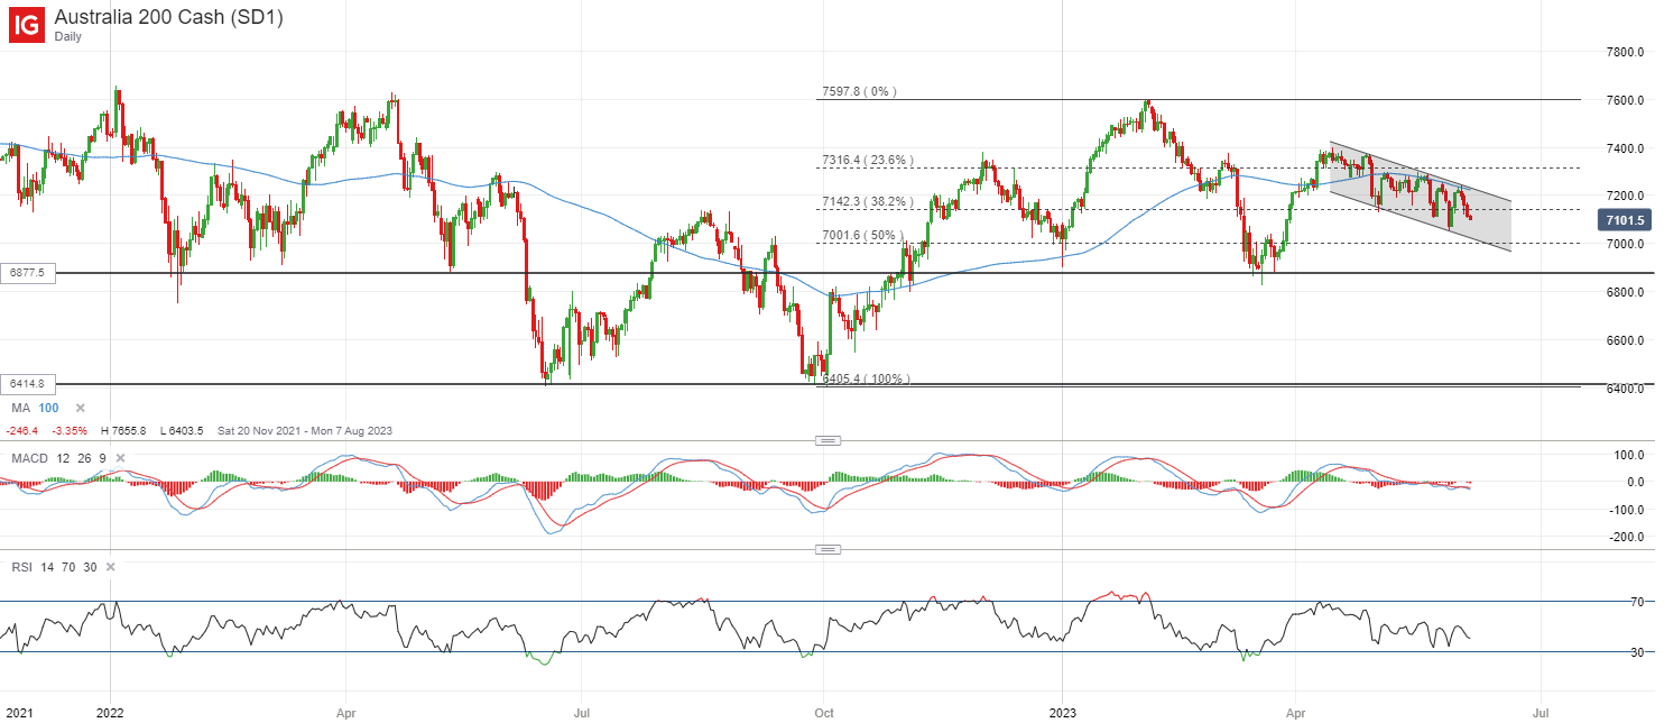
For the ASX 200, the index has been guided by a descending channel pattern lately, forming a series of lower highs and lower lows, after multiple attempts to reclaim its 100-day MA failed to materialise. Its Relative Strength Index (RSI) has been struggling to move above the key 50-level, reflecting sellers in control for now. Further downside could leave the key psychological 7,000 level on watch for a retest, where the lower channel trendline support stands. Previous dip-buying has been sighted at this level with the formation of a bullish hammer back in January this year, leaving it as a key support level to hold for the bulls.
 Source: IG charts
On the watchlist: Higher Treasury yields saw gold prices unwinding all of this week’s gains
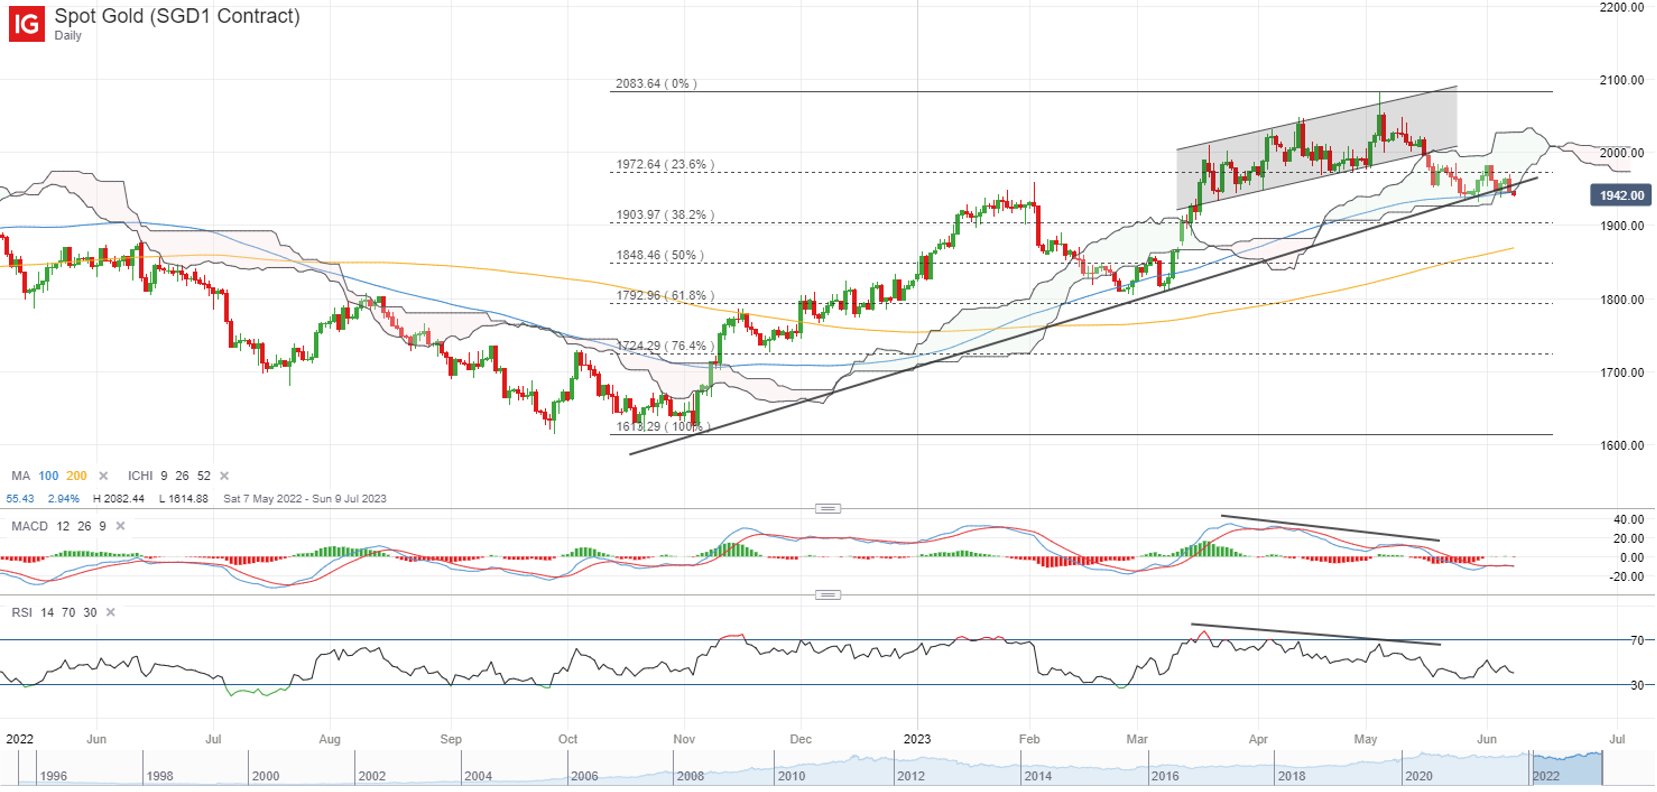
An upmove in Treasury yields overnight saw gold prices unwinding all of this week’s gains, displaying yet another short-lived bounce in defending a key support confluence zone at the US$1,940 level. That adds to the series of long-bodied red candles on the daily chart lately, which reflects the presence of strong selling pressure. Yesterday’s sell-off marked a downward break of a key trendline support and the US$1,940 will have to see some defending from the bulls ahead. Failure to do so may pave the way to retest the US$1,900 level next.
Last week’s Commodity Futures Trading Commission (CFTC) data has revealed further unwinding of net-long positioning among money managers for the third consecutive week, with still-elevated net-long positioning from previous build-up leaving room for further moderation if the trend continues.
 Source: IG charts
Source: IG charts
Wednesday: DJIA +0.27%; S&P 500 -0.38%; Nasdaq -1.29%, DAX -0.20%, FTSE -0.05%


0 Comments
Recommended Comments
There are no comments to display.
Create an account or sign in to comment
You need to be a member in order to leave a comment
Create an account
Sign up for a new account in our community. It's easy!
Register a new accountSign in
Already have an account? Sign in here.
Sign In Now