Gold price setup: Can stretched long positioning in XAU/USD trump technicals?

Entry posted by MongiIG in Market News
567 views
XAU/USD remains above vital support despite the jump in US Treasury yields; retail traders’ long positioning looks stretched and what is the outlook and key levels to watch in XAU/USD?
 Source: Bloomberg
Gold, XAU/USD: Price action & sentiment
Gold is at a critical juncture - stretched retail traders’ long positioning poses downside risks to XAU/USD. However, if the past is any guide, the yellow metal may not be ripe for a bearish break just yet.
The IG client sentiment (IGCS) chart
 Source: DailyFX
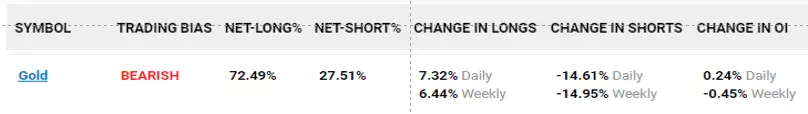
The IG Client Sentiment (IGCS) shows 72% of retail traders are net-long with the ratio of long to short at 2.6 to 1. The number of traders net-long is 6.4% higher from last week. The IGCS data at times functions as a contrarian indicator – the fact traders are net-long suggests gold may continue to fall.
XAU/USD daily chart
 Source: TradingView
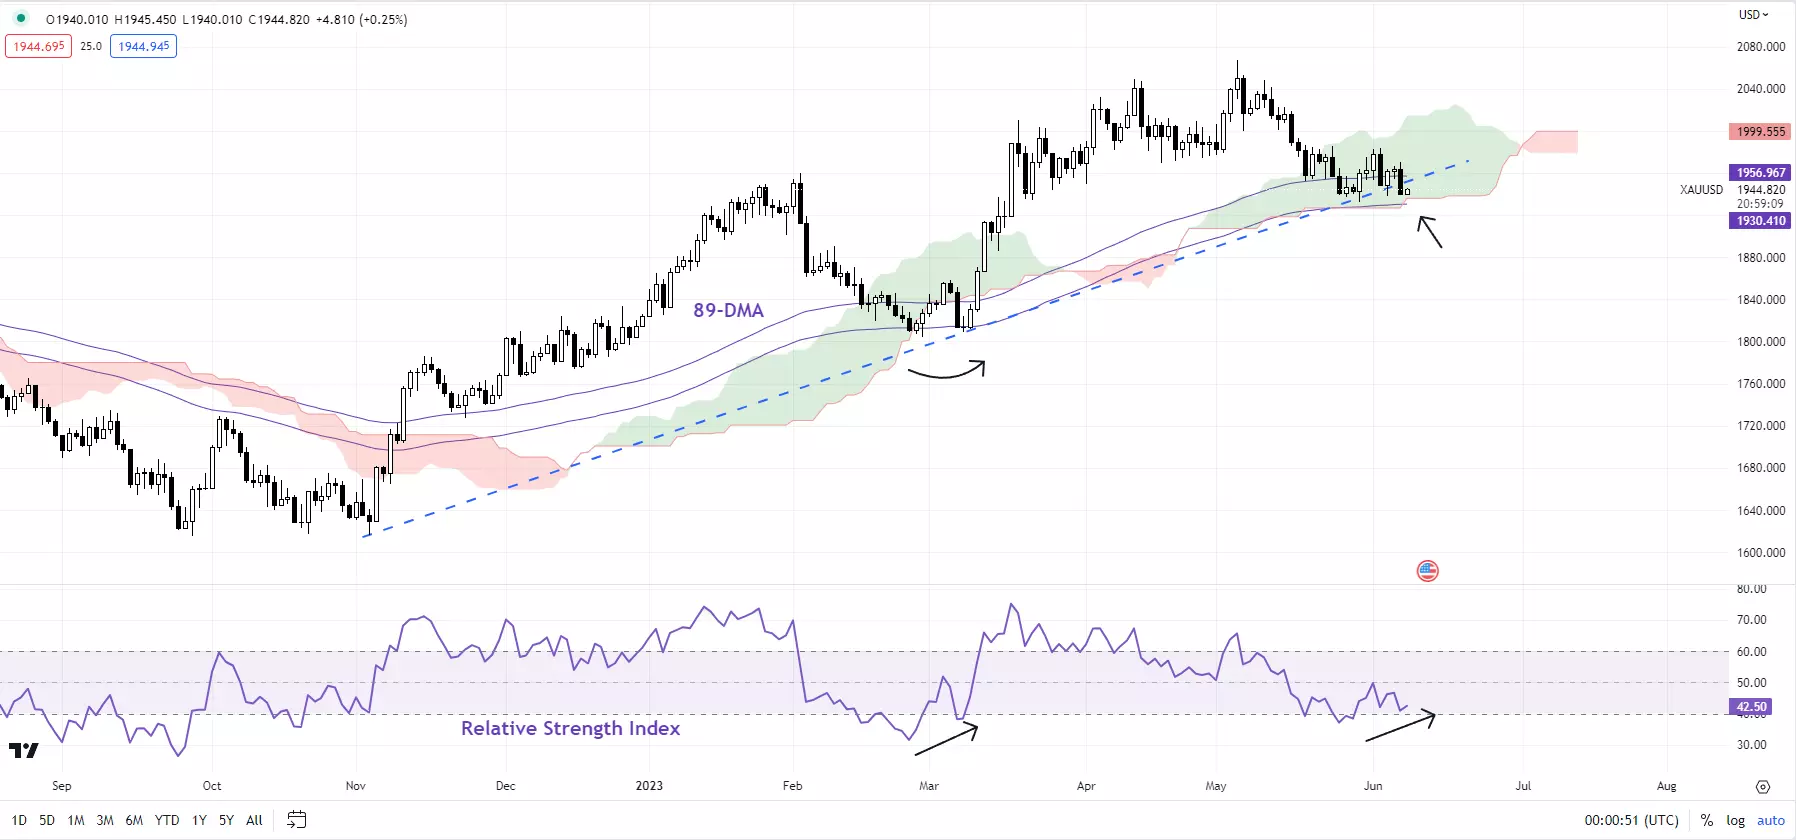
The technical setup remains broadly unchanged from the previous update.
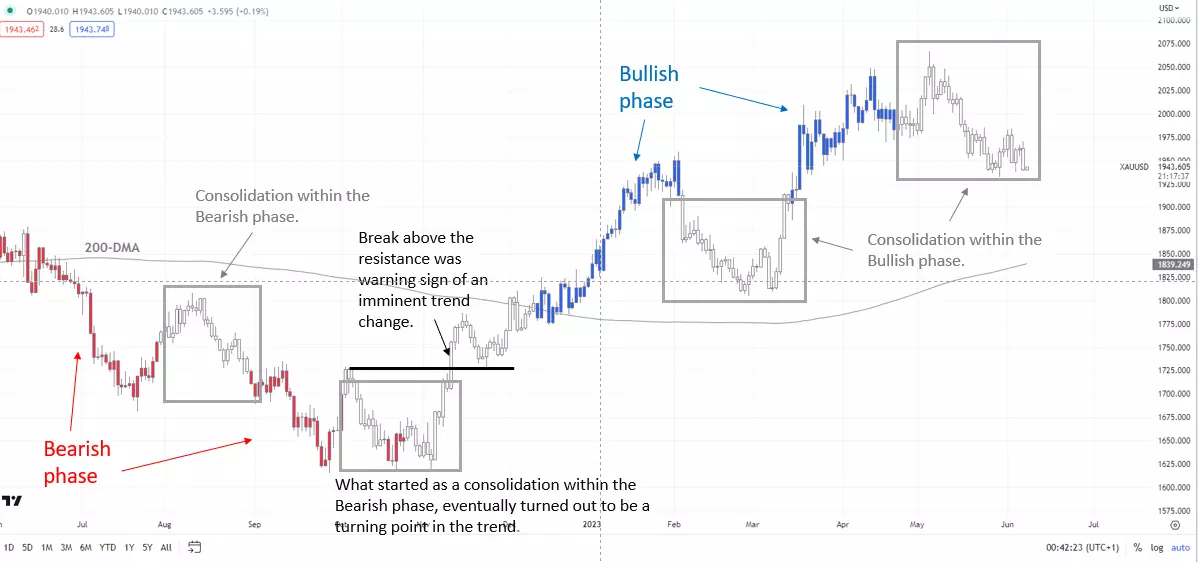
On the daily chart, gold remains above quite a strong cushion around 1930, including an uptrend line from the end of 2022, the 89-day moving average, and the lower edge of the Ichimoku cloud. The colour-coded candlestick daily charts show the current trend is a consolidation within the overall bullish structure.
XAU/USD 240-minute chart
 Source: TradingView
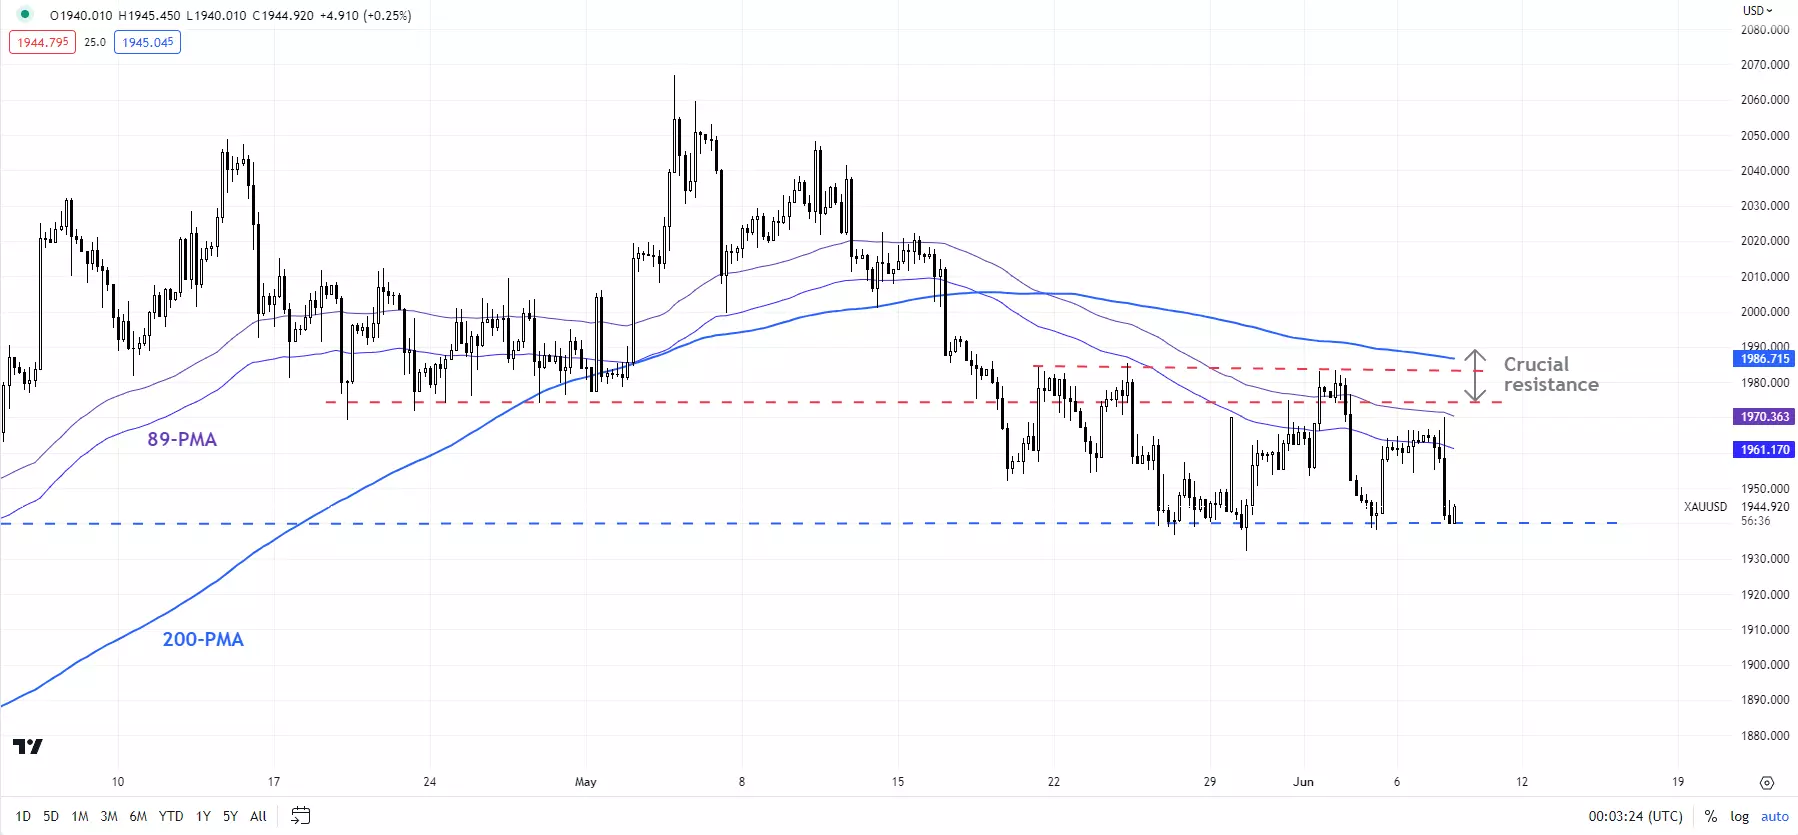
Interestingly, the 14-day Relative Strength Index (RSI) is attempting to form a base – the previous retreat earlier this year terminated with a similar setup (see the daily chart). For a material rebound to occur this time around, XAU/USD would need to clear the immediate ceiling around 1980-1987 (including the 200-period moving average on the 240-minute chart and Friday’s high).
XAU/USD 240-minute chart
 Source: TradingView
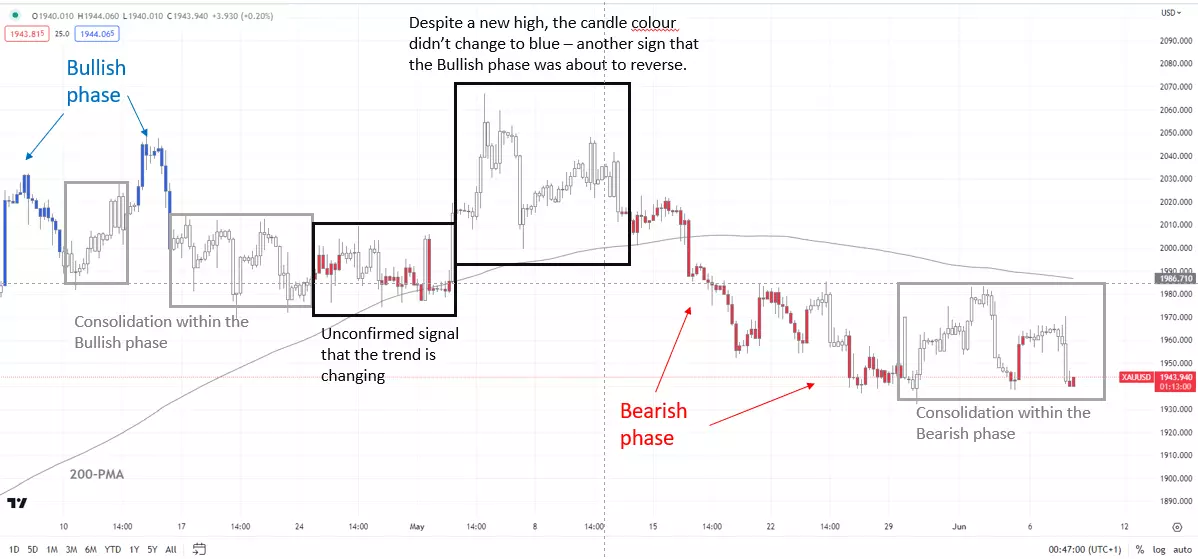
Until then, the bearish setup on smaller and higher timeframes could dominate. The 240-minute colour-coded candlestick charts show XAU/USD remains in a broadly bearish phase.
XAU/USD daily chart
 Source: TradingView
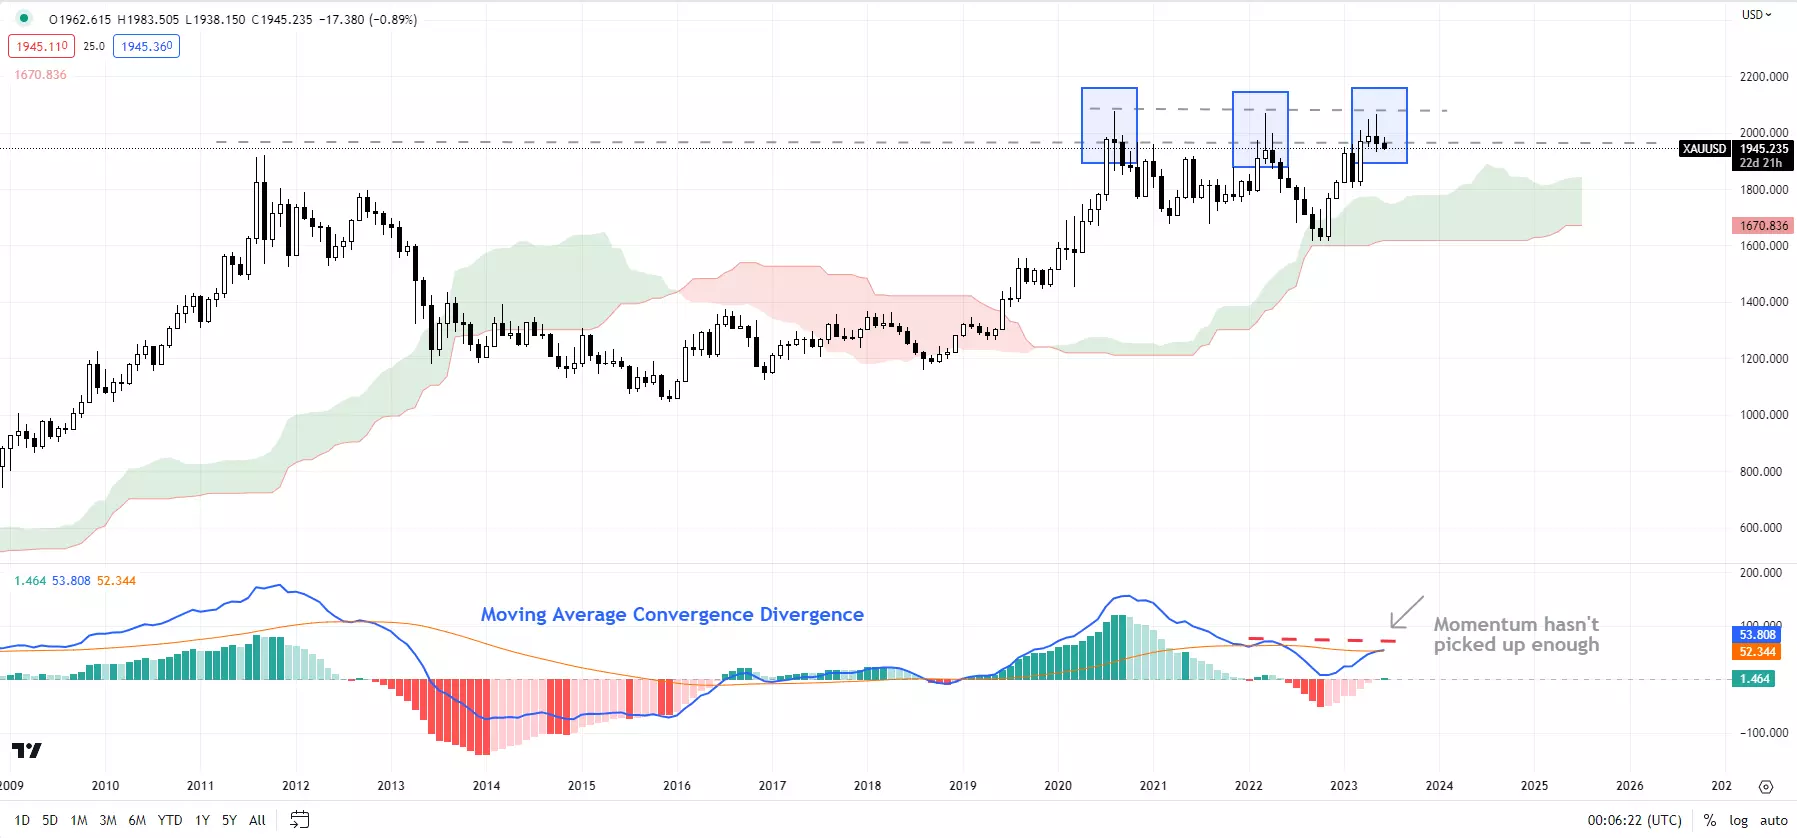
Any break above 1980-1987 could expose upside scenarios toward 2020 or even 2048. On the downside, a decisive break under 1930 could open the door toward the 200-day moving average (now at about 1840).
XAU/USD monthly chart
 Source: TradingView
*Note: In the above colour-coded chart, blue candles represent a Bullish phase. Red candles represent a Bearish phase. Grey candles serve as Consolidation phases (within a Bullish or a Bearish phase), but sometimes they tend to form at the end of a trend. Note: Candle colors are not predictive – they merely state what the current trend is. Indeed, the candle color can change in the next bar. False patterns can occur around the 200-period moving average, or around a support/resistance and/or in sideways/choppy market. The author does not guarantee the accuracy of the information. Past performance is not indicative of future performance. Users of the information do so at their own risk.


.jpg.27c55ea07d5a17683fbdbda06b8fcace.jpg)
0 Comments
Recommended Comments
There are no comments to display.
Create an account or sign in to comment
You need to be a member in order to leave a comment
Create an account
Sign up for a new account in our community. It's easy!
Register a new accountSign in
Already have an account? Sign in here.
Sign In Now