Lumber collapse could be preparing us for another massive surge this year

Entry posted by ArvinIG in Analyst Article
583 views
Lumber has suffered massive losses over recent months, yet historical trends highlight the potential for another bullish surge this year.

Source: Bloomberg
Lumber valuations axed after incredible pandemic rally
Lumber has gone from one of the bigger pandemic outperformers to simply an example of incredible volatility, with the price falling 70% in the two-months following the May peak of $1711.88. On the supply-side, the huge surge in prices appears to have come as a result of the supply constraints emerging off the back of Covid-19 restrictions and lockdowns.
Meanwhile, the surge in government spending and lockdown DIY demand saw the market tighten further. However, with restrictions easing, both sides of that dynamic appear to have eased over recent months.
Nonetheless, with the US looking likely to approve a $1 trillion infrastructure package and house prices continuing to rise thanks to rock bottom rates, there is a good chance we will see prices turn higher before long.
Long-term trend highlights move towards key support
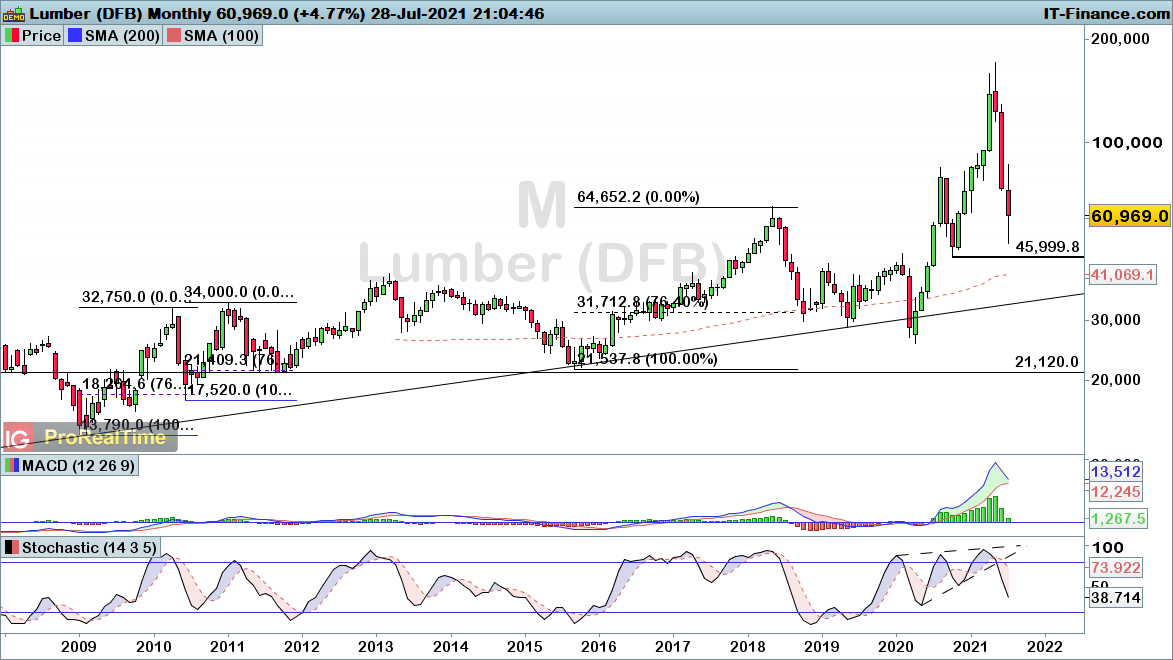
The monthly chart highlights how this capitulation has brought the price back down towards the crucial October 2020 swing low of $460. A break below that threshold would point towards a potential move back down towards the wider ascending trendline.
However, whether we do see a break below that $460 threshold or not, any weakness over the coming months are likely to provide another buying opportunity given the long-term uptrend in play over the past 13-years.
Source: ProRealTime
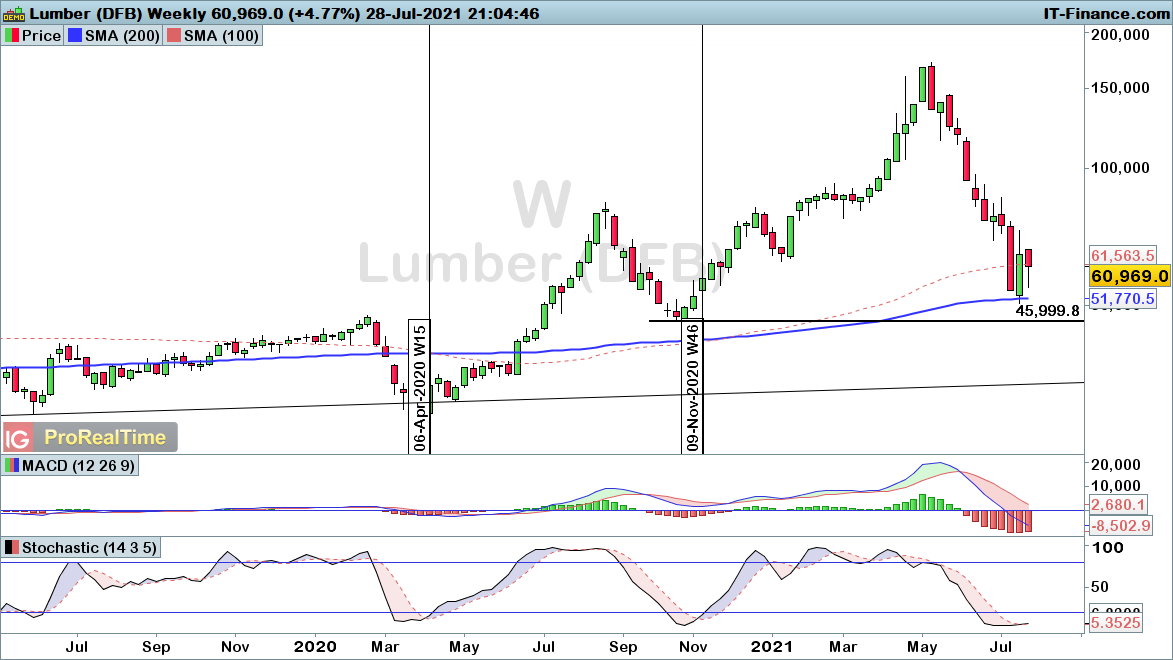
The weekly chart highlights the break back into oversold territory in July.
While an oversold reading does not necessarily result in a buying opportunity, the past two rallies up out of that zone have provided timely signals that Lumber was about to surge higher. With the stochastic crossing over this week, there is a good chance we are gearing up for such a bullish signal.
Source: ProRealTime
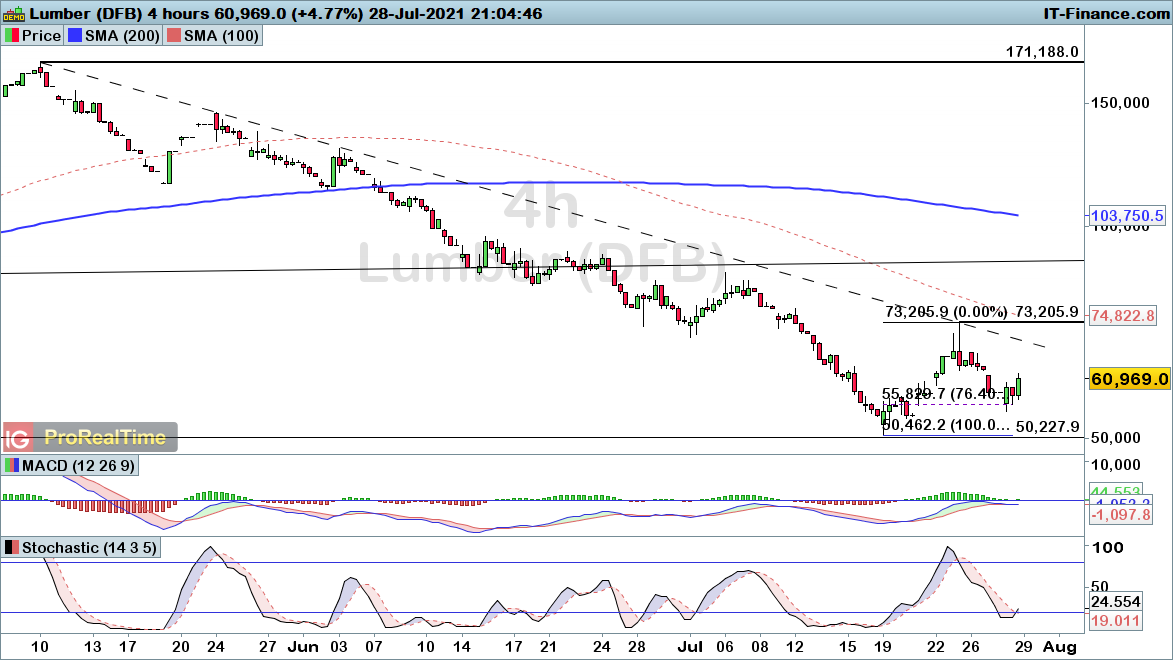
From an intraday perspective, we can see the potential for a bullish reversal here. Today’s rally comes after a pullback into the 76.4% Fibonacci support level.
Crucially, the descending trendline and $732 resistance level provide key hurdles which have to be overcome to bring about a more bullish picture for Lumber.
Source: ProRealTime
Seasonality chart brings optimism for the bulls
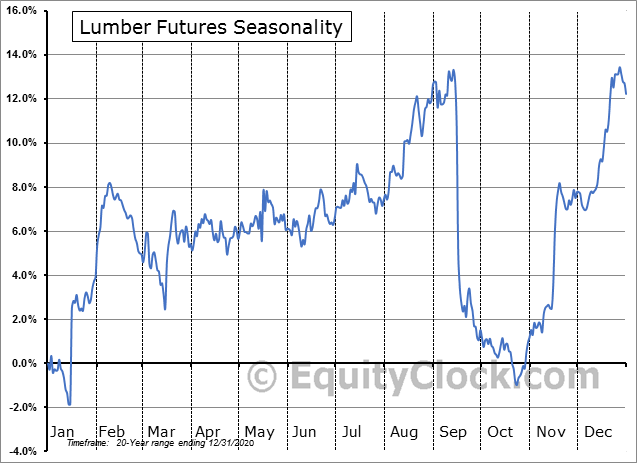
From a seasonality perspective, we can see that the fourth quarter (Q4) typically provides a particularly buoyant period for Lumber prices. However, that comes off the back of a relatively dramatic decline in September. Could this point towards another leg lower to bring price into the longer-term ascending trendline before we rise once again? Perhaps.
However, what we can see is that a sharp eradication of the year’s gains in the second half of the year is not abnormal. That reversal historically results in a bullish reversal to regain lost ground and bring us back into a positive end to the year.
Thus whether we do see further short-term downside, this current pullback is in fact part of a seasonal trend that typically resolves in a dramatic recovery towards the end of the year.
Source: EquityClock.com
Finally, transmitting that seasonality onto price action, we can look at the quarterly chart to see how this has played out specifically throughout the 13-year uptrend. The vertical lines have been drawn on Q4, which the graph above highlights as the best three-month period for Lumber.
Undoubtably, we have seen an impressive trend of outperformance in Q4 over the years, with nine of the past 12 Q4 periods ending in the green (75%). Notably, those three quarters where Lumber did lose ground were minimal in nature (>5% downside).
With this in mind, there is good reasoning behind the idea that the losses we are seeing over recent months could soon enough bring another major buying opportunity for the bulls to come back into dominance.
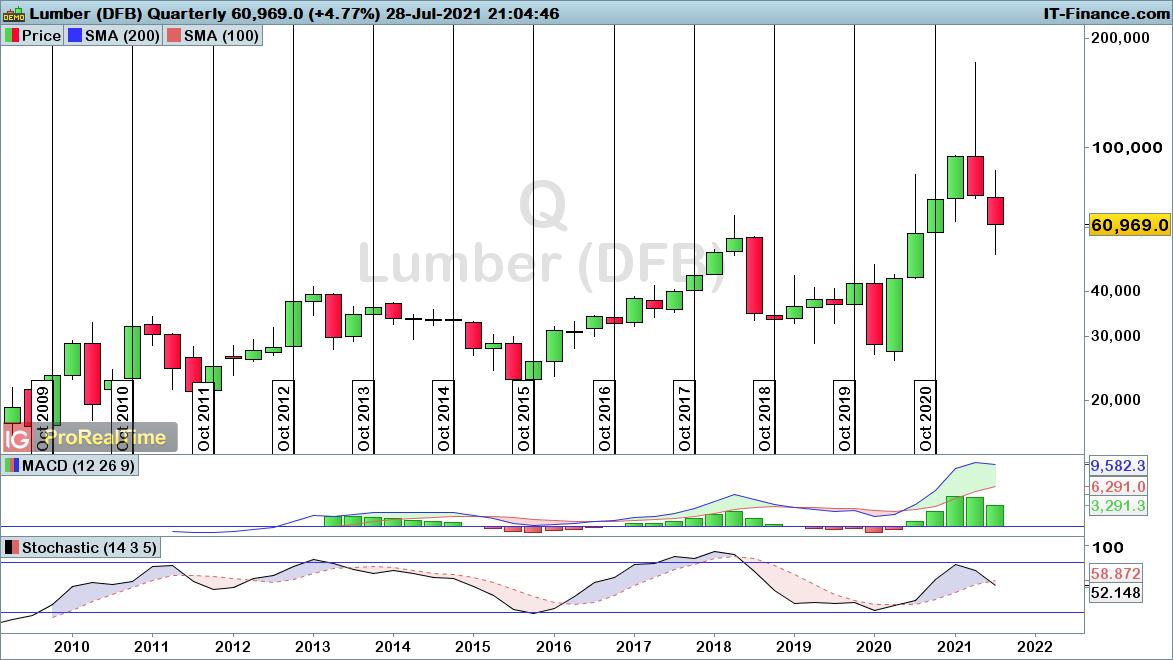
Soruce: ProRealTime


0 Comments
Recommended Comments
There are no comments to display.
Create an account or sign in to comment
You need to be a member in order to leave a comment
Create an account
Sign up for a new account in our community. It's easy!
Register a new accountSign in
Already have an account? Sign in here.
Sign In Now