Jump to content

Where now for the Nasdaq 100?


MongiIG

2,198 views

Tech stocks have powered higher in recent months and the Nasdaq 100 now sits at a record high once more. Can this run continue?

NasdaqSource: Bloomberg
 
 Chris Beauchamp | Chief Market Analyst, London | Publication date: Wednesday 11 August 2021. IG

Back in the first half of 2021, there was no shortage of gloomy commentary about tech stocks. From being the market stars of the past year, it seemed tech had run out of room to rally.

The expected reopening of the global economy was foretold to be the moment that investors would move away from the FANG winners of 2020 and find sectors and companies that would benefit from people leaving their homes and returning to physical shopping and working from offices, rather than working and shopping from the comfort of their homes.

Perhaps unsurprisingly, this has not come to pass. Indeed, fund managers have rediscovered the attractions of the sector, with huge inflows over the recent weeks that has played a major part in driving the Nasdaq 100 to a new record high, taking out the 15,000 level for the first time in its history.

For a time, it looked like big tech stocks like Amazon would continue to struggle. A stellar year in 2020 meant that stock prices of FANG names had risen very quickly, but from September onwards the relentless gains began to stall.

Other sectors began to take over the mantle of leadership, and a rise in treasury yields seemed to suggest that the era of buying tech stocks had come to a close, given their valuations were so high that much of the risk appeared to be skewed to the downside.

The Nasdaq 100 currently sits at a record high, having enjoyed huge gains since May. Sentiment surrounding this index and the heavyweight names such as Amazon has undergone a major shift over the past six months, as investors switched from growth to value and then back again.
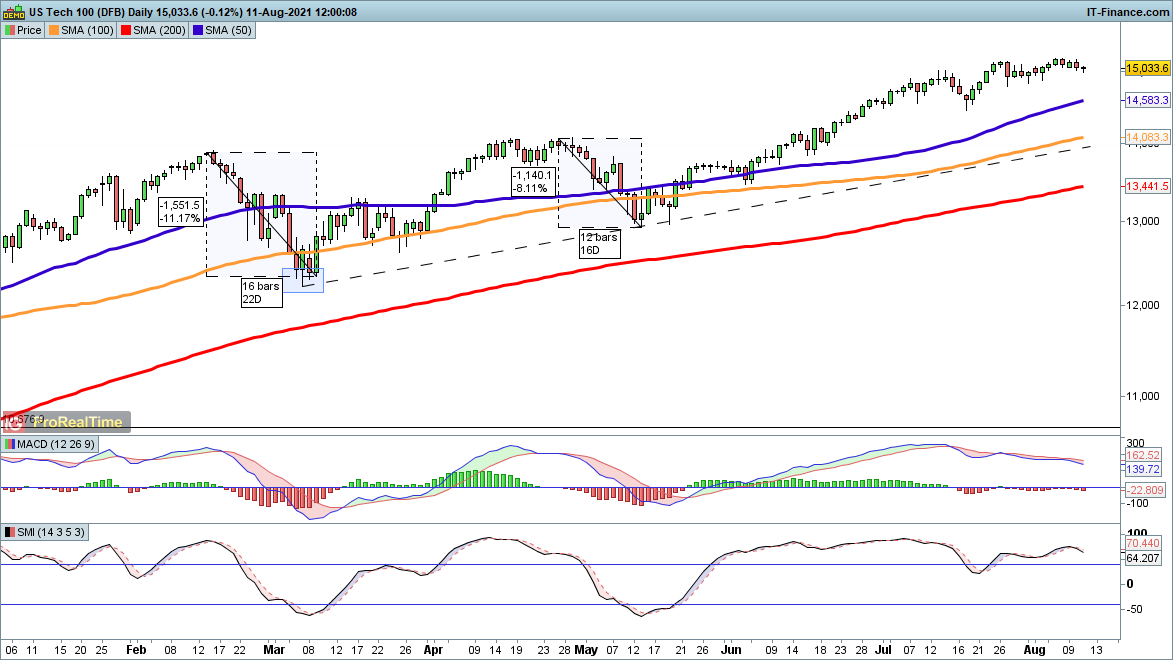
Nasdaq 100 chartSource: ProRealTime


From a chart standpoint, the trend is firmly intact, and has been substantially revived since the uncertain February – May period. From May we have seen a renewed surge to the upside, as inflows have supported the sector and pushed it to a new record high.

We have now gone an extended period without any major volatility, and historically August-September can see some weakness creep in before a year-end rally gets underway.

But investors appear to have woken up to the strong fundamentals of the sector, particularly the cash-generation powers of the big FANG stocks, and have found renewed faith in growth stocks and their ability to deliver strong market returns.

0 Comments


Recommended Comments

There are no comments to display.

Create an account or sign in to comment

You need to be a member in order to leave a comment

Create an account

Sign up for a new account in our community. It's easy!

Register a new account

Sign in

Already have an account? Sign in here.

Sign In Now
  • Blog Statistics

    • Total Blogs
      3
    • Total Entries
      2,821
  • Latest Forum Topics

  • Our picks

    • Are these the best AI stocks to watch in May 2024?
      Microsoft, Apple, Nvidia, Amazon and Meta could be the best AI stocks to watch next month. These stocks are the largest AI stocks in the US based on market capitalisation.
    • Natural Gas Commodity Elliottwave Technical Analysis
      Natural Gas


      Mode - Impulsive 


      Structure - Impulse Wave 


      Position - Wave (iii) of 5


      Direction - Wave (iii) of 5 still in play


      Details:  Price now in wave iii as it attempts to breach 1.65 wave i low. Wave (iii) is still expected to extend lower in an impulse.


      Natural Gas is currently breaching the previous April low, marking a decisive move as the impulse initiated on 5th March continues its downward trajectory, further extending the overarching impulse wave sequence that commenced back in August 2022. This decline is anticipated to persist as long as the price remains below the critical resistance level of 2.012.


      Zooming in on the daily chart, we observe the medium-term impulse wave originating from August 2022, which is persisting in its downward trend after completing its 4th wave - delineated as primary wave 4 in blue (circled) - at 3.666 in October 2023. Presently, the 5th wave, identified as primary blue wave 5, is underway, manifesting as an impulse at the intermediate degree in red. It is envisaged that the price will breach the February 2024 low of 1.533 as wave 5 of (3) seeks culmination before an anticipated rebound in wave (4). This confluence of price movements underscores the bearish sentiment prevailing over Natural Gas in the medium term.


      Analyzing the H4 chart, we initiated the impulse wave count for wave (3) from the level of 2.012, which marks the termination point of wave 4. Notably, price action formed a 1-2-1-2 structure, with confirmation established at 1.65 and invalidation set at 2.012. The confirmation of our anticipated direction materialized as price breached the 1.65 mark, signifying a resumption of bearish momentum. Presently, there appears to be minimal resistance hindering the bears, thereby reinstating their dominance in the market. It is projected that wave iii of (iii) of 5 will manifest around 1.43, indicative of the potential for the wave 5 low to extend to 1.3 or even lower. This comprehensive analysis underscores the prevailing bearish outlook for Natural Gas in the immediate future.


      Technical Analyst : Sanmi Adeagbo
       
        • Like
    • Meta Platforms’ earnings round-up: Share price plunged despite 1Q beat
      Meta’s share price plunged as much as 16% in post-market trading, following the release of its 1Q 2024 results.
×
×
  • Create New...
us