Hang Seng Index attempting to rebound from nine-month low

Entry posted by MongiIG in Market News
1,001 views
Hang Seng Index is down close to 6.5% year-to-date. Does its recent bounce indicate a longer-term shift in sentiments?
 Source: Bloomberg
Hang Seng Index – What to expect
The ongoing uncertainty surrounding Chinese equities continues to revolve around the increased regulatory risks weighing on its large domestic technology firms, which takes up more than 25% weightage of the Hang Seng Index. This includes clampdown on algorithms that restrict competition and increased supervision of data collection, which directly put a cap on companies’ profitability. With recent release of a five-year blueprint calling for greater regulation across key industries, one may expect more restructuring to come, with no quick resolution of the situation.
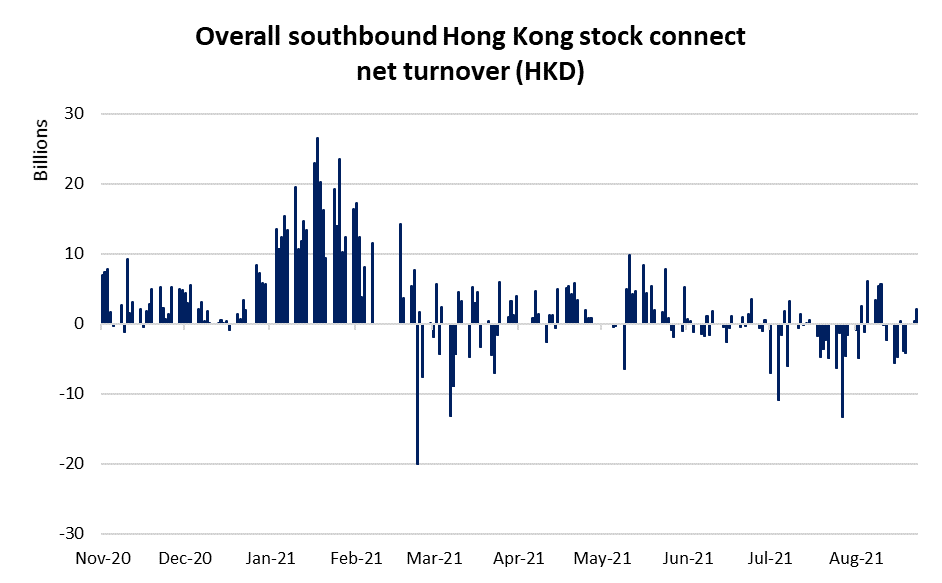
Based on the daily southbound Hong Kong stock connect net turnover, there have been net inflows of around HKD2.6 billion over the past two trading days. Bottom-fishing sentiments have been fuelled by stellar corporate earnings drawing interest from some institutional investors, along with Tencent Holdings' share buyback. Although yesterday’s inflow was the highest in two weeks, overall fund flow for August still stands at a net outflow of HKD1.5 billion. Therefore, it awaits to be seen if the recent up-move indicates a longer-term shift in sentiments.
 Source: HKEX
Valuation
As increased regulatory risks bring about uncertainty over forward earnings, a look at Hang Seng Index’s price-to-book (P/B) ratio suggests that valuation is currently trading close to two standard deviations below its five-year mean. This brings its valuation close to the Covid-19 sell-off back in early 2020, which is its lowest historical P/B ratio to date. However, with the uncertainty to future earnings from new regulations, profitability valuation metrics have been showing up conflicting signals, which will only be able to draw greater clarity over the longer term.
Technical analysis
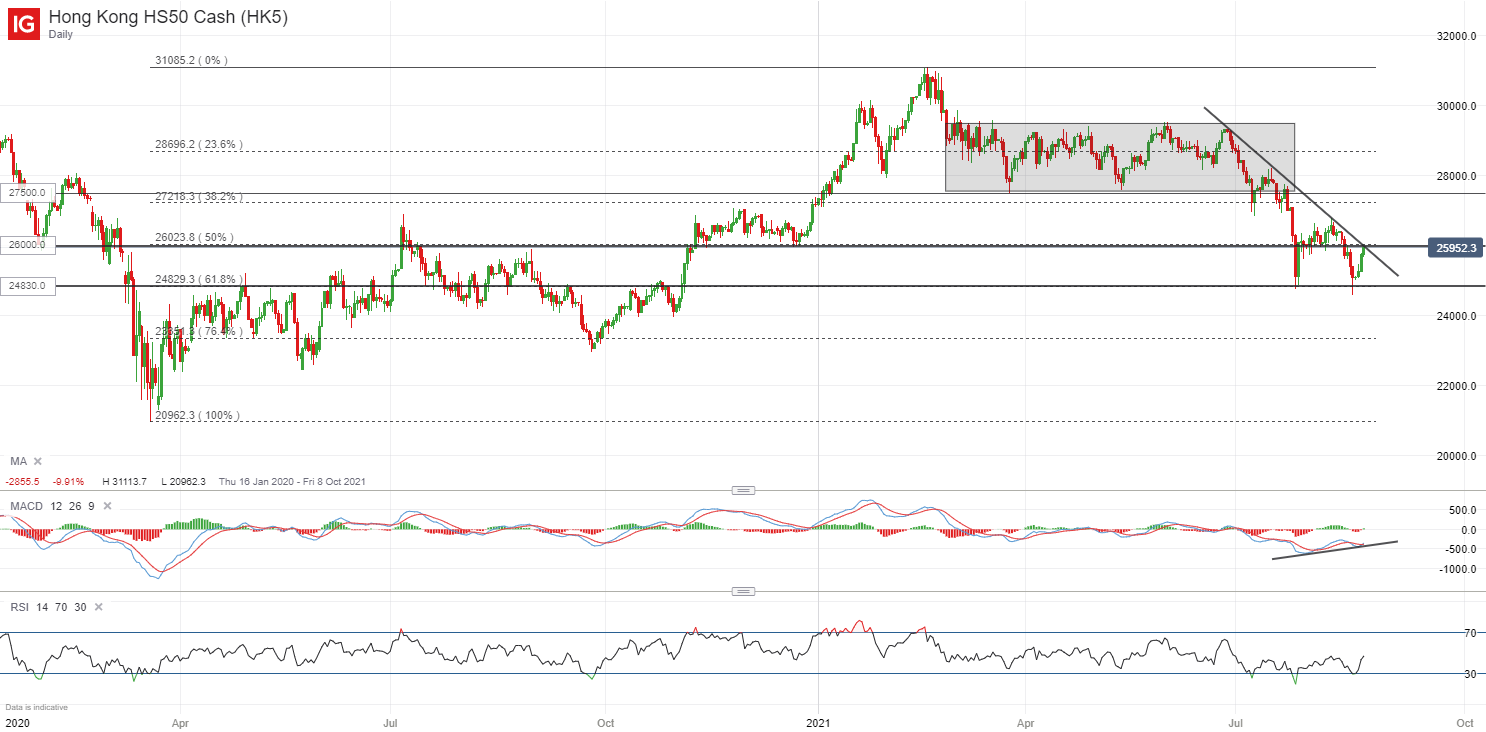
On the daily chart, the index has seen a recent bounce off the 24,830 level, where a previous resistance level is now serving as support. This level may also draw some technical buyers from the Fibonacci 61.8% retracement level. With the Moving Average Convergence Divergence (MACD) indicator displaying higher lows, it suggests that downside momentum is weakening in the near term. That said, the index may find some resistance at 26,000, where a recent attempt to bounce off this level in early August was unsuccessful. This level also coincides with a downward trendline, which has been connecting lower highs since June. A retracement from this level may bring about a lower high, marking a continuation of its near-term downtrend.
 Source: IG Charts
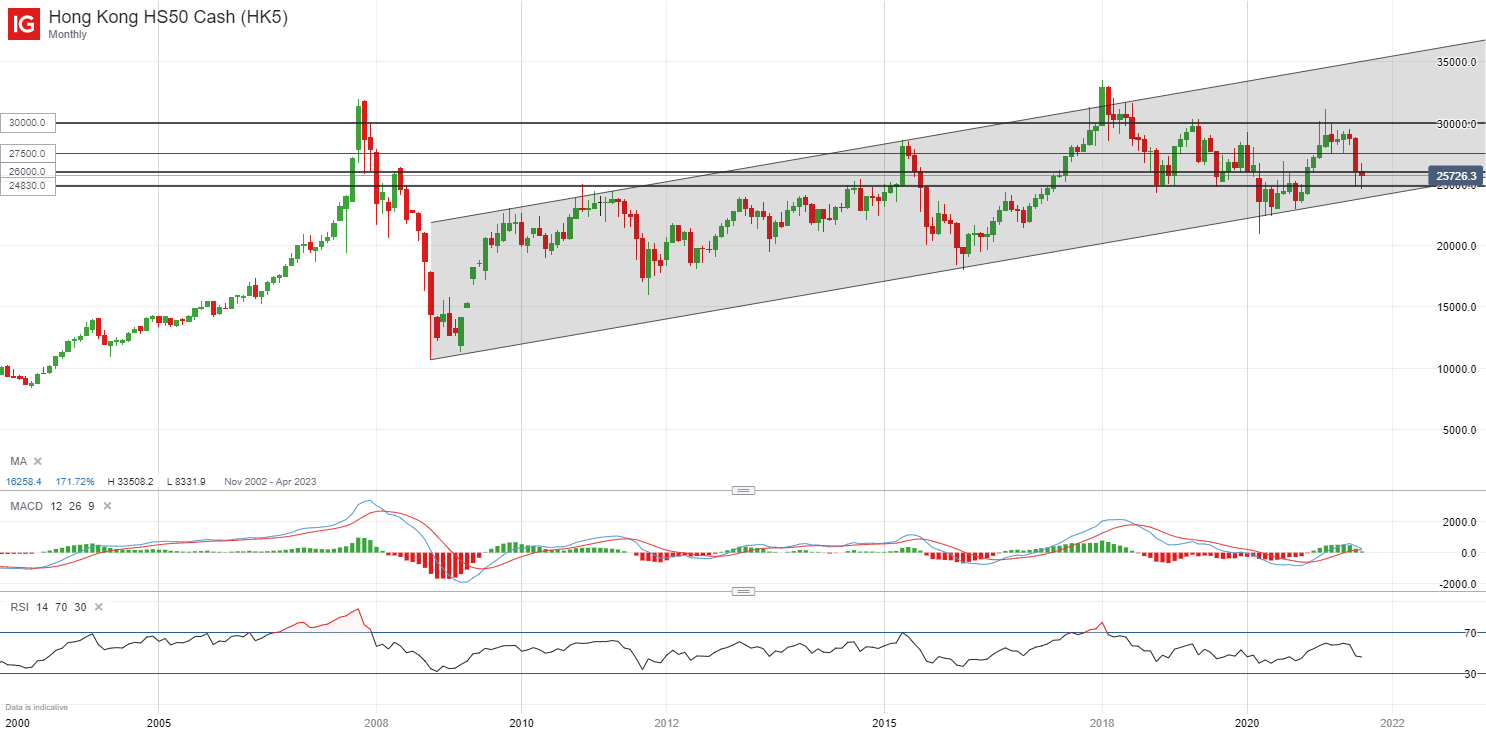
A look at the monthly chart suggests that an ascending channel pattern has been in place. This points towards the 24,300 level potentially providing longer-term support, where the bottom trendline of the channel pattern has held up the index on previous four occasions. Longer-term resistance may be found at the psychological 30,000 level, where the index was weighed on previous two occasions.
 Source: IG Charts


.jpg.27c55ea07d5a17683fbdbda06b8fcace.jpg)
.png.02f0e5e742ffe3a81b011c17df3009ee.png)


0 Comments
Recommended Comments
There are no comments to display.
Create an account or sign in to comment
You need to be a member in order to leave a comment
Create an account
Sign up for a new account in our community. It's easy!
Register a new accountSign in
Already have an account? Sign in here.
Sign In Now