

AndrewS
-
Posts
235 -
Joined
-
Last visited
-
Days Won
3
Content Type
Profiles
Forums
Blogs
Events
Community Tutorials
Store
Everything posted by AndrewS
-
A partial cure for bias.

-
Well I will take a close look at how prices react to this week's and month's range. There are some interesting candlesticks and I think strong support is about 5% away for some of these indices.

-
Caseynotes , you may be right about the news, but the drop started at 8 am Tokyo time.
-
Stock market turning points - are we there yet?
AndrewS replied to Mercury's topic in Indices and Macro Events
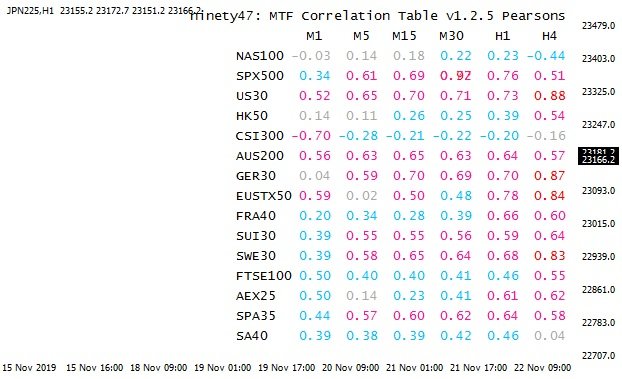
Hello Mercury, I follow the correlations as well. I have a quantitative reason for not following the CSI300 ( correlation too low) and the EUSTX50 (too similar to the Dax). I even have a reason to favour daily, hourly and 15 minute candles. This is what the correlations of the SPX500, JPN225 and GER30 look like over the last 24 hours of trading.

-
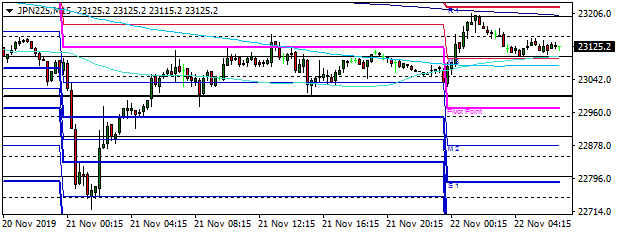
I did some spring cleaning and I have three timeframes for the S&P500, Nikkei225 and Dax on my main monitor. It is partly because of this. https://www.dailyfx.com/forex/education/trading_tips/post_of_the_day/2011/03/31/How_Many_Candles_Should_be_Viewed_on_a_Chart.html Well this is what the Nikkei225 looks like with a yearly R1 pivot where the daily R1 pivot is and the Flash Manufacturing PMI in at 48.6.

-
Caseynotes, thank you for your reply. What I meant was that it seems to me that the characteristic of the price movements seems to me to change somewhat at the end of each month and the behavior of the price movements have a different character in the next month. Perhaps I have an overly imaginative pattern recognition.
-
I do not use monthly pivots because I have found them to be inconsistent. But I took a look at them on the S&P500 and it seems to me that there is a reset around the end of the month, as though an algorithm had been changed. I am interested in people’s comments.

-
A confluence on the S&p500 on Friday. Resistance turned support just above a big round number as well as a retracement to a daily and weekly R1 pivot and a 20 hour moving average. Notice how the 20 hour moving average looks somewhat more interesting on a 15m chart.


-
Yearly_Pivots.mq4 on the JPN225. The index retraced to within 1 point of the R1 the other day.

-
Indicator showing the correlations between the SPX500 and a number of currency pairs and indexes across several time frames.


